 |
|
Expert Technical Commentary Delivered Straight To Your Inbox
|
| November 4, 2017 |
Hello Fellow ChartWatchers!
Welcome to the latest edition of ChartWatchers, the newsletter for technical analysts, online investors, StockCharts users and more. In addition to this week's articles, don't forget to check out the Site News section (below) for some important announcements and updates about what's going on around StockCharts this month!
Until next time,
- Grayson Roze
Having trouble viewing this email? Click Here to view online
|
|
|
|
ChartCon Returns in 2018! Join Us Online OR In Person!
We are thrilled to announce that ChartCon, our biennial investing and technical analysis conference, is returning in 2018! Broadcast live online for two full days – Aug. 10th & 11th, 2018 – we will be featuring live presentations from a long list of incredible speakers, including John Murphy, Martin Pring, Dr. Alex Elder, Arthur Hill and many more. It's the premier technical analysis event of the year. Period.
To learn more about ChartCon 2018, Click Here. Registration officially opens in early 2018, so stay tuned for more information and announcements as we get closer to the new year!
But that's not all... New for this year's ChartCon, we've reserved a small number of seats in the room at the event and are inviting you to join us LIVE as a VIP! Meet the experts in person, share dinner and drinks with the presenters and the StockCharts team, and immerse yourself in the action of the conference. Plus, as an added bonus, we're even offering the chance to join us for a post-conference, all-inclusive Alaska cruise after ChartCon ends! Set sail for a week of exploration and adventure, and keep the ChartCon spirit alive with special VIP events, lectures, training sessions and more.
To learn more about our VIP packages for ChartCon 2018, Click Here. But hurry! Space is very limited and guaranteed to sell out quick.
MarketWatchers LIVE - 5 Days Per Week!
Last Wednesday, Chip (President and Founder of StockCharts.com) joined Tom Bowley and Erin Swenlin live on the air to announce an exciting change to our MarketWatchers LIVE web show. This month, MarketWatchers LIVE will move to 5 days a week! Follow Tom and Erin each day, Monday through Friday from 12:00pm to 1:30pm ET, as they dissect the current market action and bring you the expert technical perspective.
Click Here to learn more about our MarketWatchers LIVE web show.
|
|
|
|
|
|
|
by John Murphy
|
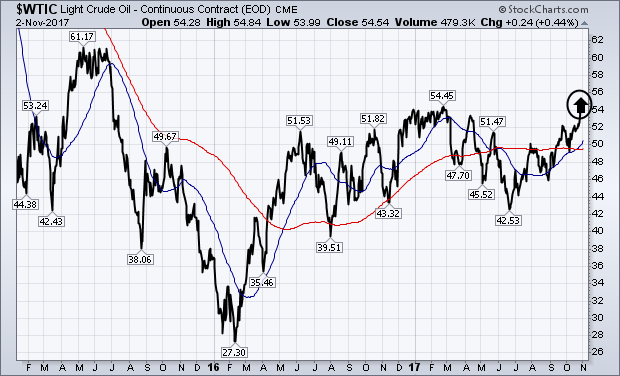 |
My Wednesday message showed Brent Crude Oil trading over $60 for the first time in more than two years. Brent is trading over $62 today. It also showed West Texas Intermediate Crude Oil (WTIC) trying to break through overhead resistance at $55. Chart 1 shows WTIC trading slightly above that resistance barrier today ($55.69). If it's able to hold above that level, that would mark its first close... |
|
|
|
|
|
|
by Arthur Hill
|
 |
An uptrend means prices are advancing and higher highs are the order of the day. We do not know how long a trend will persist, but there is clear evidence that trends persist. Just look at the S&P 500 since early 2016 for a recent example. The 50-day EMA crossed above the 200-day EMA in April 2016 and this golden cross remains in play - some 19 months later and 25% higher. Dozens of stocks... |
|
|
|
|
Bookstore Special
|
|
|
|
by Greg Schnell
|
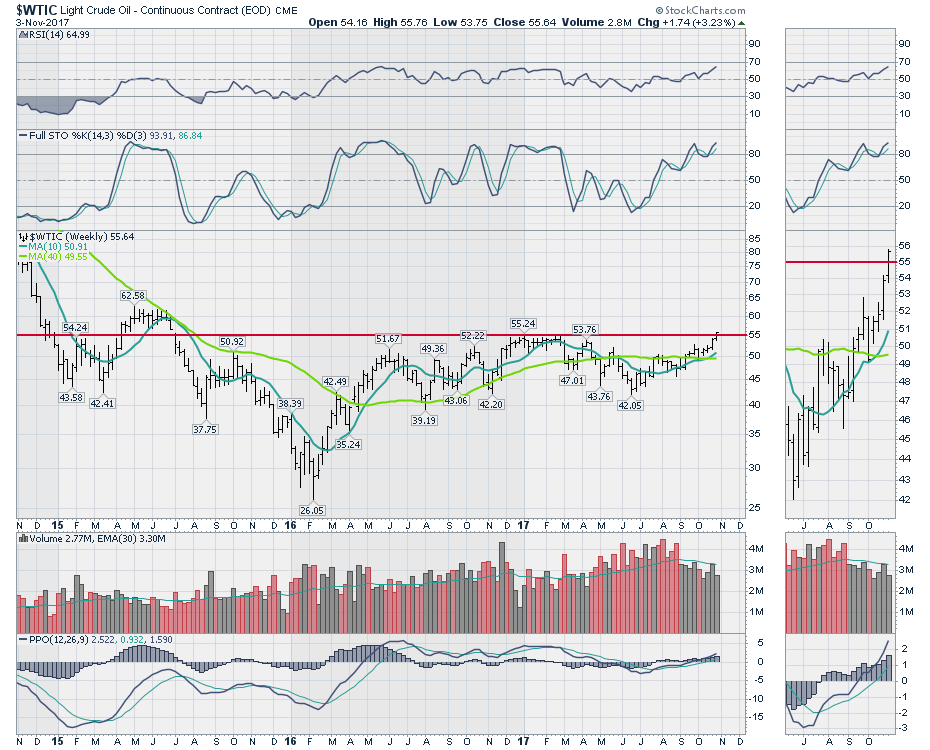 |
The price of oil closed above all the weekly closing highs for the last two years to kick off November. West Texas climbed on Friday above all the intraday highs and all the daily closes to put an exclamation mark on the breakout. A weekly close is more important than a daily close so Friday's action was a big positive for energy related trades. These gains also showed up in some of the large... |
|
|
|
 |
|
|
|
by Tom Bowley
|
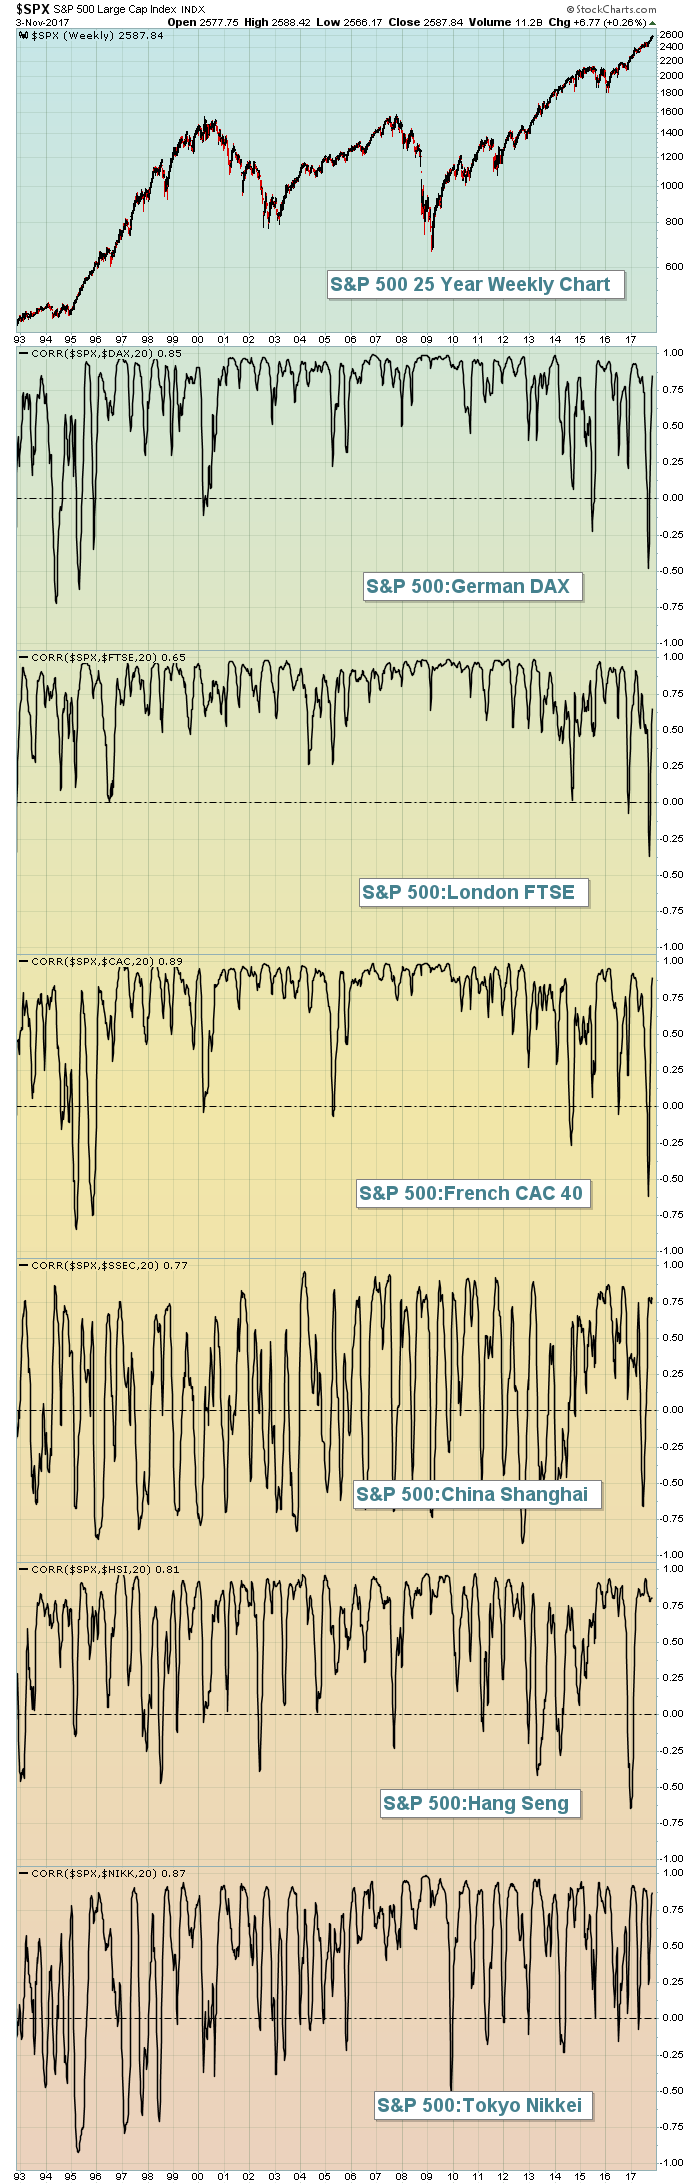 |
When considering this question, I believe the correlation indicator tells us most of what we need to know. After all, we're pondering which global market movements tend to be reflected in similar movements in the U.S. market. For purposes of the U.S. market, I'll focus on the benchmark S&P 500. Correlation measures how two asset classes, indices, sectors, stocks, etc... |
|
|
|
|
|
|
by John Hopkins
|
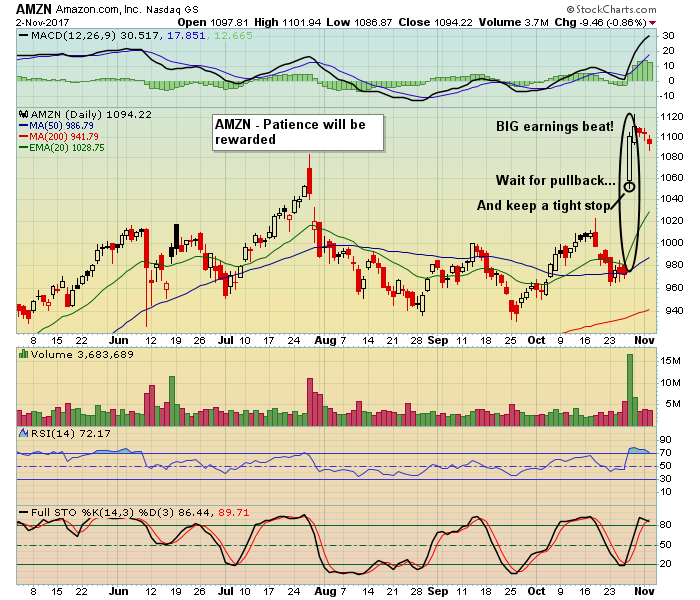 |
Earnings Season is winding down. So far it's been quite positive. How do I know? Just look at the overall market. We certainly saw strong earnings from the tech giants including Amazon, Apple, Facebook and Google. In fact all of these are ripe for nice trades IF you are willing to be patient. As an example, take a look at the chart on Amazon below which rose sharply on massive |
|
|
|
|
|
|
by Erin Heim
|
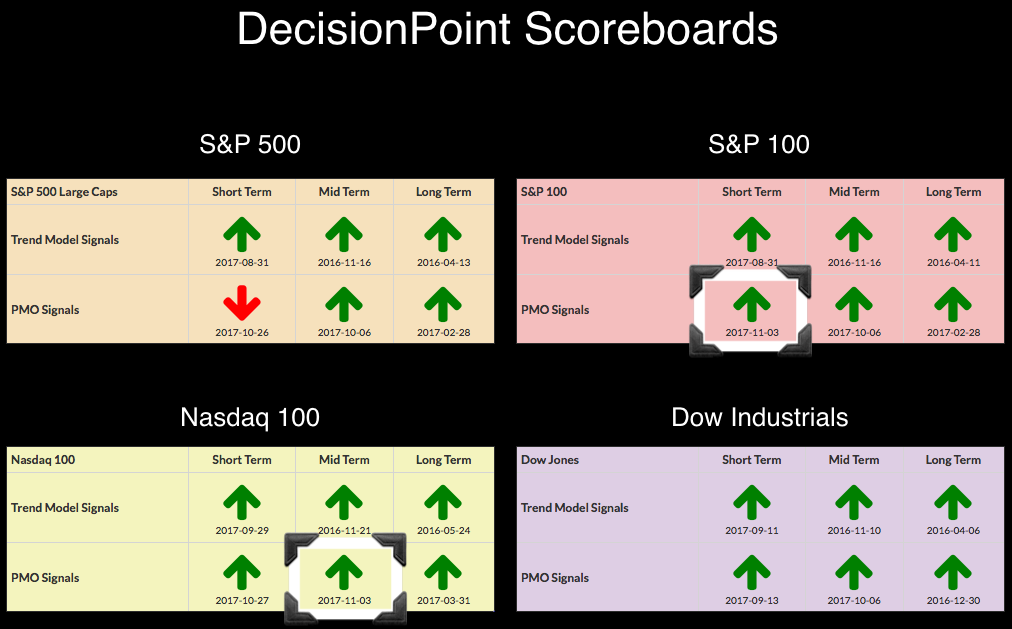 |
I've been expecting a new PMO BUY signal on both the SPX and the OEX. The OEX managed to wrangle the PMO above its signal line, but the SPX is struggling to garner its PMO BUY signal. Big news on Oil! We just got a new Long-Term Trend Model BUY signal which technically means there is a bull market bias in the long term for USO. Let's start with the NDX which produced (finally!) an... |
|
|
|
|
|
|
by Gatis Roze
|
 |
A note to my readers: It is with great pride that I have written The Traders Journal blog every week since 2012 - 52 weeks a year. I am deeply grateful for the support and loyal following of all my readers throughout that time. However, I must announce that today marks the end of my writing blogs on a weekly basis. From here on and with... |
|
|
|
|
|
|
|
|
|
Unlock All of Our
Tools and Features
- + Larger, Full-Screen Chart Sizes
- + Intraday Charts with Real-Time Data
- + Exclusive, Members-Only Commentary
- + Custom Technical Scans and Alerts
|
|
|
|
|
 |
|
|
|
ChartWatchers is our free, twice-monthly newsletter for online investors and StockCharts users. Whether you are brand new to charting or a seasoned analyst, each edition of ChartWatchers brings you insightful, expert commentary from the industry's leading technicians. See what's really happening in the markets through their eyes and gain an edge in your own investing.
|
|
|
|
|
|
| For more information about the ChartWatchers Newsletter or to subscribe for free, Click Here |
This email was sent to [email]. Need the newsletter sent to a different email address?
Simply unsubscribe your current email, then re-subscribe using the new address. |
| Click Here to instantly unsubscribe |