 After falling for over a year, the Regional Bank ETF (KRE) finally got its mojo back in the fourth quarter of 2019 and broke out to new highs. The ETF then became overextended in mid December and fell back to the 200-day SMA here in February. A potentially bullish setup is taking shape, but a positive correlation to the 10 Year Treasury Yield could spoil the setup. Banks are not happy campers with the recent decline in Treasury yields, and this decline is extending.
Let's first hit the Regional Bank ETF. The long-term trend is up for three reasons. There was a breakout in late October, the ETF hit a 52-week high in mid December and the PPO(20,200,0) is positive.
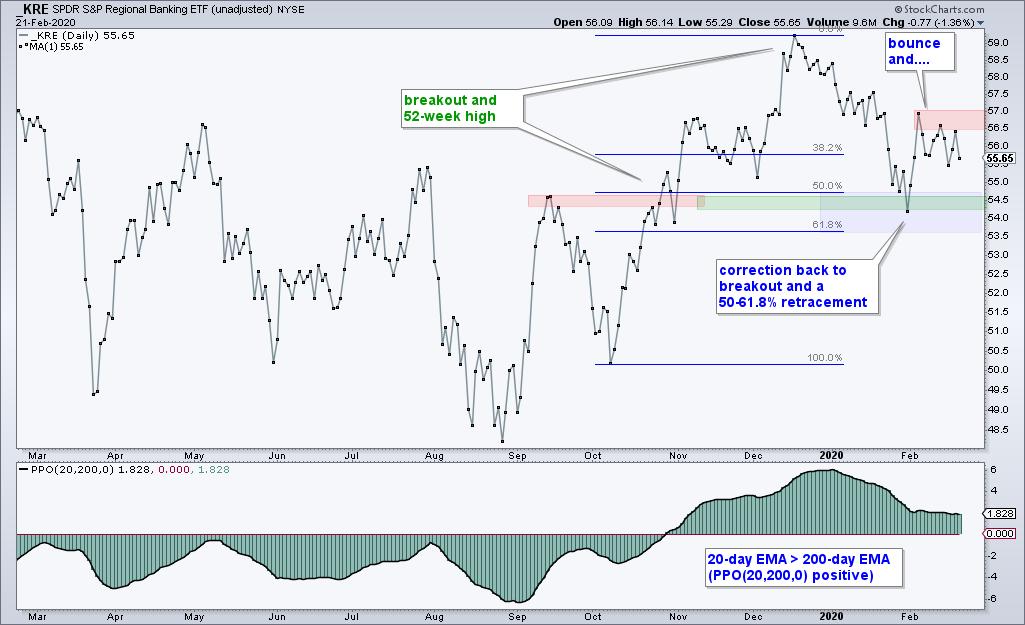
After hitting a new high, the ETF fell back to the breakout zone by retracing 50-61.8% of the prior advance. A return to the breakout zone and ~50% retracement are normal for corrections after big advances. Think of it as two steps forward and one step backward. Thus, the correction is a potential bullish setup for the next leg higher.
Even though the long-term trend is up and the pullback looks like a correction, KRE is lagging since mid December and there was NO follow through to the early February bounce. Note that SPY is up over 4% since mid December and KRE is down 6%. Such a big performance discrepancy puts the onus on the bulls to prove the bears wrong here in 2020. A breakout at 57 would show follow through and put the bulls back in control.
The decline and new low in the 10-yr Treasury Yield ($TNX) is also a concern for banking stocks. $TNX fell below 1.5% (15 on the chart) and closed at its lowest level since June 2016. It is clearly a bear market in Treasury yields, and a bull market in Treasury bonds.
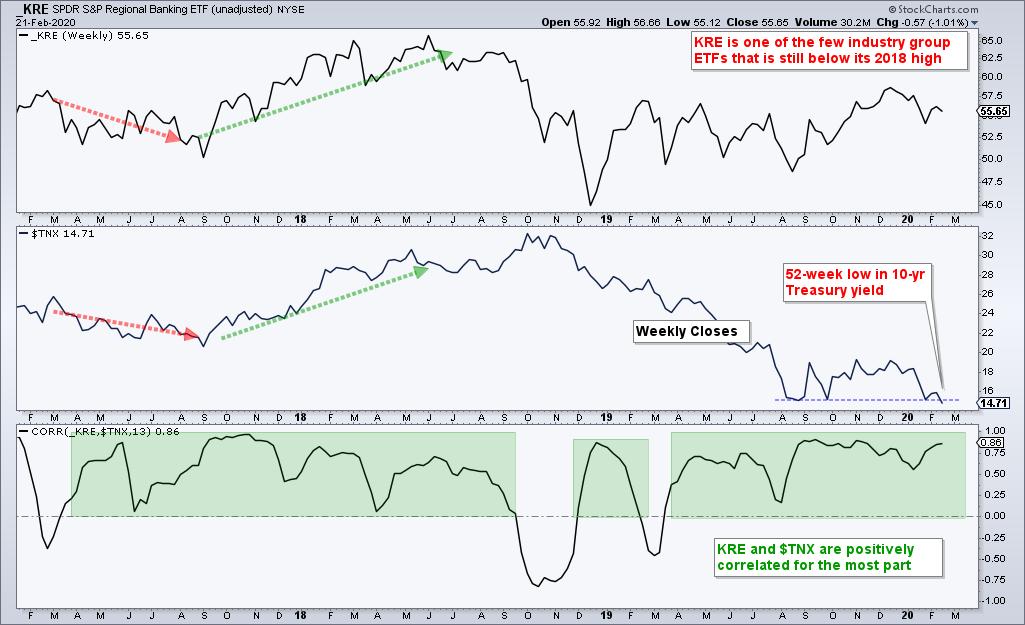
The indicator window shows the 13-week Correlation Coefficient spending most of its time in positive territory. This means KRE and $TNX tend to move in the same direction. This also suggests that a new low in the 10-yr yield is negative for KRE. Nevertheless, keep an eye on the KRE chart because relationships are subject to change. Note that the Dollar and Gold are now positively correlated. Returning to the business at hand, a breakout at 57 in KRE would still be bullish. The Bank SPDR (KBE) sports a similar chart setup.
KRE and KBE are part of 60 ETFs in the Core ETF ChartList at TrendInvestorPro.com. Subscribe today for immediate access to the following: weekly ETF report, ETF ranking tables, market timing models, ETF ChartBook, weekend video, Saturday stock setups and more.
Click here to take your charting to the next level!
----------------------
Choose a Strategy, Develop a Plan and Follow a Process
Arthur Hill, CMT
Chief Technical Strategist, TrendInvestorPro.com
Author, Define the Trend and Trade the Trend
Want to stay up to date with Arthur's latest market insights?
– Follow @ArthurHill on Twitter
– Subscribe to Art's Charts
