I've received many questions recently on stocks experiencing overbought conditions, from stocks like Activision Blizzard (ATVI), which recently broke above RSI 70, to Amazon (AMZN), which has an RSI that has breached 80.
What does it mean to be overbought? Is that a sell signal? What do I look for next? Let's review some charts together.
ATVI is a great example of what I would call a plain vanilla overbought situation. The RSI has just creeped above 70, similar to what happened in September 2019 and May 2020. In both cases, the stock pulled back in the subsequent 2-3 weeks.
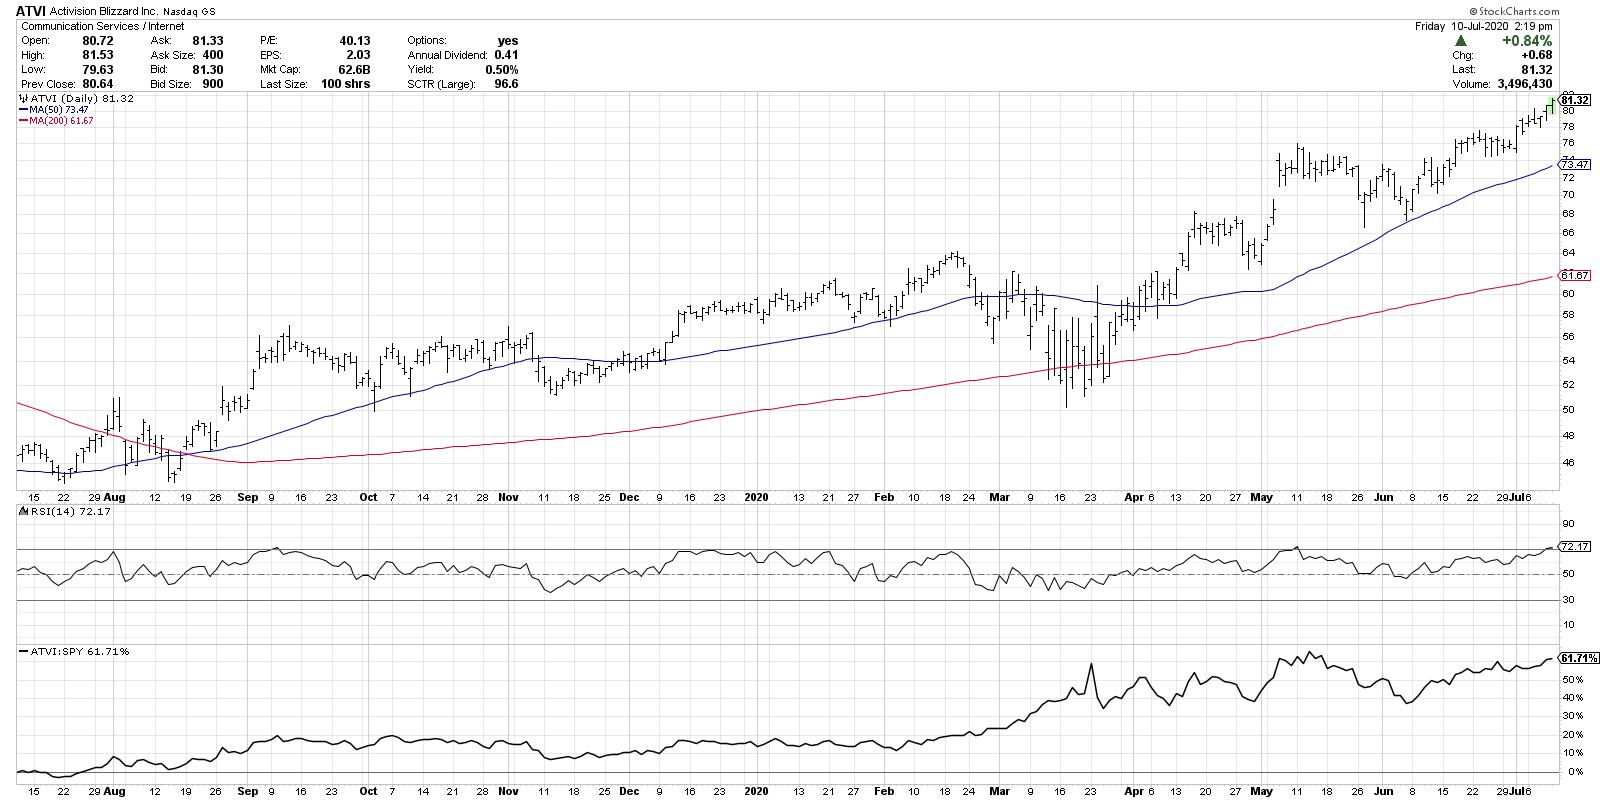
But note that the overall trend on Activision has been overwhelmingly positive. Even though the RSI overbought condition suggested a short-term top, both pullbacks then resolved higher as the price achieved new highs soon after.
What's key on the ATVI chart is how low the RSI reached after the overbought conditions. Note that, on pullbacks in price, the RSI never really got below the 40 level. This is a classic formation for a bull market phase, where the stock becomes overbought in upswings and never gets to the oversold level on pullbacks.
So, if and when Activision pulls back here and the RSI breaks back below 70, I would expect at least a brief pullback, and I would note where the RSI reaches as the price retraces.
With Amazon (AMZN), we have a different situation, as the RSI has become extremely overbought and is currently above 80.
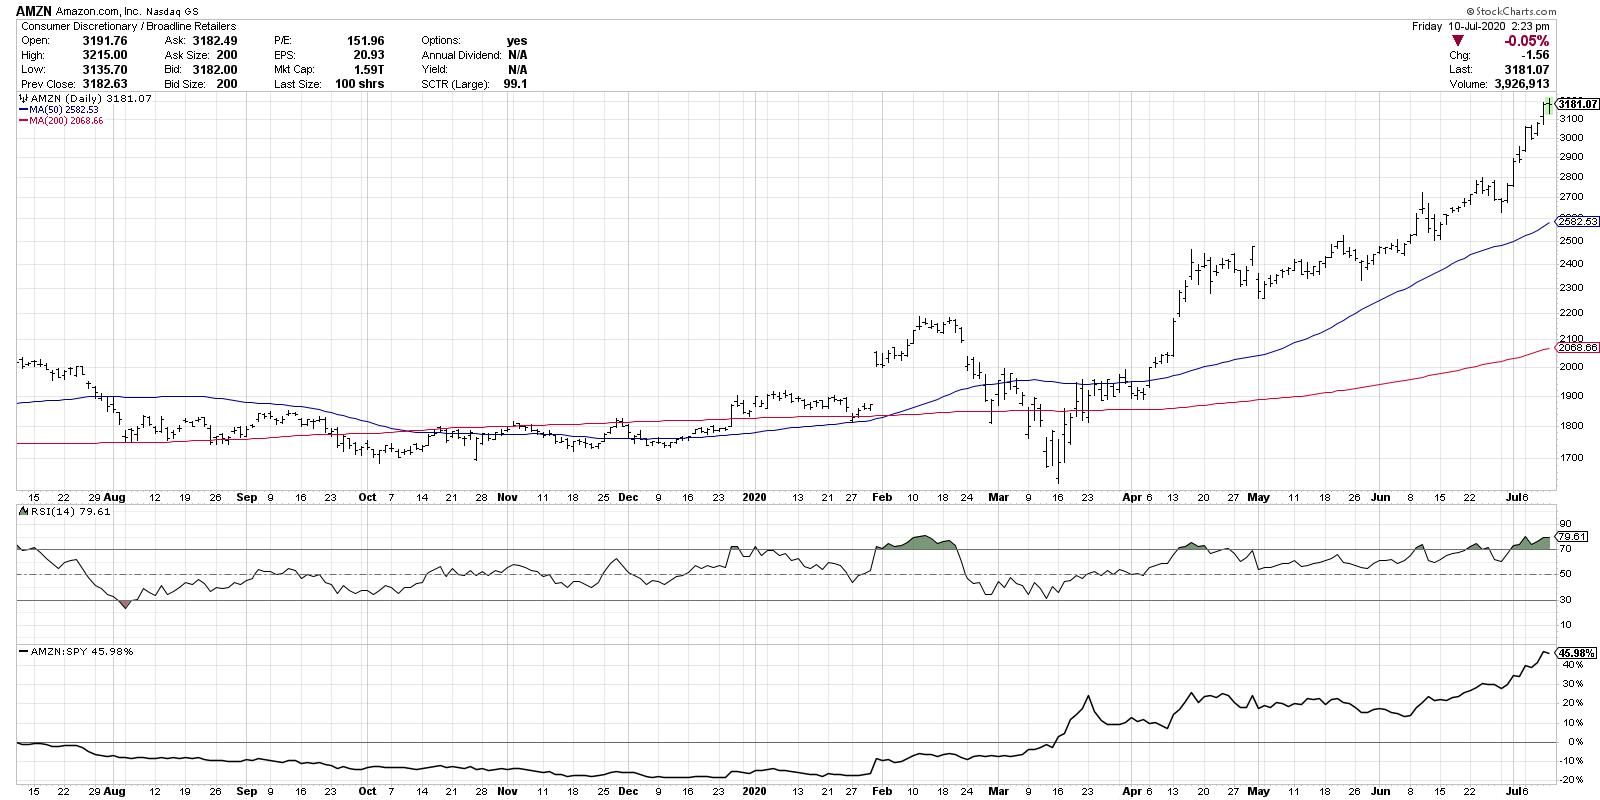
When the RSI goes above 80 in an uptrend, I tend to call that a "good overbought," as the upside momentum is so strong that, even though you'd expect a brief pullback, I usually assume we'll see at least one more push higher. What's key here is what the RSI does on that next push higher, as it will often achieve a lower peak and form what's called a bearish divergence with price.
For examples of this, see the AMZN chart in February 2020 and April 2020, both of which saw the price achieve a higher close while the RSI sloped downwards. This suggested a weakening of momentum on the secondary rally and indicated an exhaustion of the uptrend.
Finally, we get to Tesla (TSLA) and a chart that truly defies expectations.
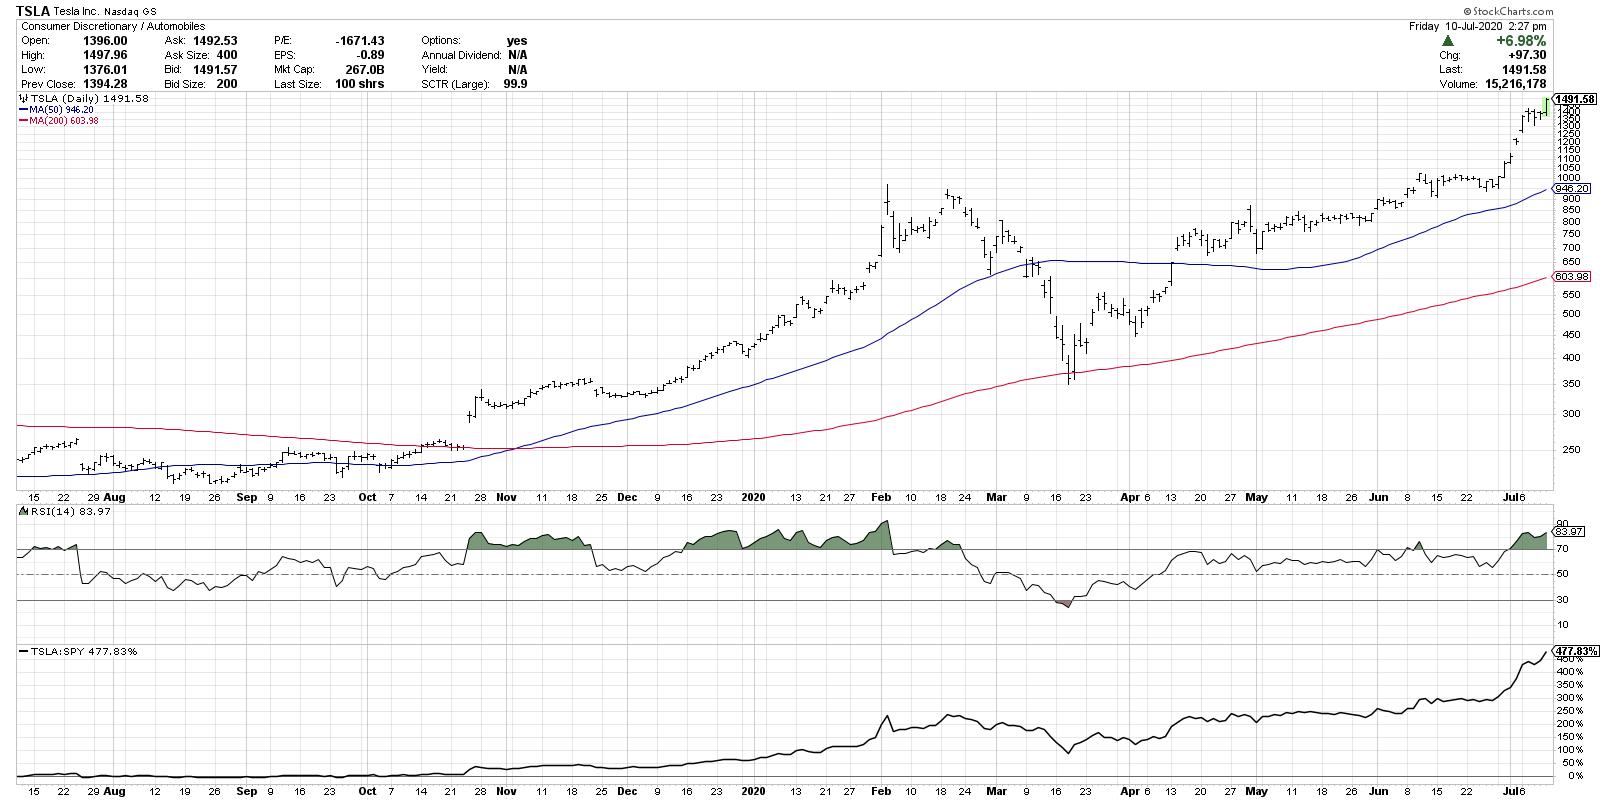
TSLA has become extremely overbought, with an RSI almost reaching the extremely uncommon 90 level. With a chart like this, I tend to switch to trend-following mode and assume the trend is higher until proven otherwise.
At some point, the price will retrace to some degree. Once that happens, we can see how the RSI evolves during a pullback. Until that time, you have to acknowledge that stocks can become overbought and remain overbought for extended periods of time. Oct 2019-Feb 2020 are a perfect illustration of this phenomenon.
So here we have three stocks in various degrees of overbought conditions. My first suggestion is to remember that becoming overbought is not a bad thing. "Overbought means up a lot" - and, overall, that is good! Warning signs should emerge when the RSI exits the overbought region, especially when a subsequent upswing in price is met with a lower upswing in RSI.
Until then, the trends remain positive.
RR#6,
Dave
David Keller, CMT
Chief Market Strategist
StockCharts.com
Disclaimer: This blog is for educational purposes only and should not be construed as financial advice. The ideas and strategies should never be used without first assessing your own personal and financial situation, or without consulting a financial professional.
The author does not have a position in mentioned securities at the time of publication. Any opinions expressed herein are solely those of the author, and do not in any way represent the views or opinions of any other person or entity.