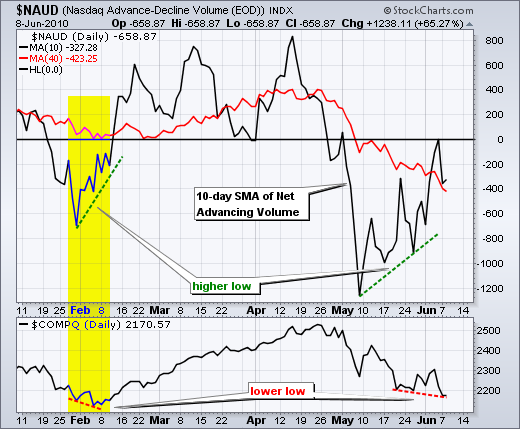
The stock market rebounded on Tuesday, but the bounce was rather lopsided as techs lagged significantly. The S&P 500 and the Dow gained over 1%, but the Nasdaq and Russell 2000 finished slightly negative. Small-caps and techs are starting to show relative weakness and this is not a good sign for the market overall. Small-caps started underperforming in late May and techs started underperforming over the past week. I am going to show the same two breadth charts today. These seem to capture the short-term possibilities quite well. The 10-day SMA for Nasdaq Net Advancing Volume has a bullish divergence working over the last four weeks and surged to the zero line last week. A push into positive territory would be short-term bullish for the indicator and could foreshadow a bounce in the market. The 10-day SMA for NYSE Net Advancing Volume also has a bullish divergence working and a surge into positive territory would be short-term bullish.


On the daily chart, SPY formed a harami as the white body of Tuesday's candlestick was inside the red body of Monday's candlestick. This is similar to an inside day. However, notice that SPY dipped below Monday's low so it was not a "full" inside day. Candlestick bodies represent the open and close. This means Tuesday's open-close range was inside Monday's open-close range. Overall, SPY continues to test support from the February lows. Since mid May, we now have two long white recovery candlesticks and a harami in the 104-406 area. This is still bottom picking territory, but I remain concerned with relative weakness in small-caps and techs. We may need a break below the February lows, a surge in bearish sentiment and a selling climax to put in a sustainable low. Follow through above the late May and early June highs is need to fully reverse the downtrend on the daily chart. RSI has a small bullish divergence working and a break above 50 would turn momentum bullish.

On the 30-minute chart, SPY established a new resistance level with the morning high and broke this level with an afternoon surge. It is positive to see a strong close after so many weak closes. A bottom picker's breakout remains in play with support in the 104.5-105 area. RSI remains in bear mode as it has yet to break the 50-60 resistance zone that has held since late April.

Key Economic Reports:
Wed - Jun 09 - 10:30 - Oil Inventories
Wed - Jun 09 - 14:00 - Fed Beige Book
Thu - Jun 10 - 08:30 - Initial Claims
Fri - Jun 11 - 08:30 - Retail Sales
Fri - Jun 11 - 09:55 - Michigan Sentiment
Charts of Interest: ACV, ADP, AEE, ALTR, AMGN, ATVI, FITB, HCBK, YUM


This commentary and charts-of-interest are designed to stimulate thinking. This analysis is not a recommendation to buy, sell, hold or sell short any security (stock ETF or otherwise). We all need to think for ourselves when it comes to trading our own accounts. First, it is the only way to really learn. Second, we are the only ones responsible for our decisions. Think of these charts as food for further analysis. Before making a trade, it is important to have a plan. Plan the trade and trade the plan. Among other things, this includes setting a trigger level, a target area and a stop-loss level. It is also important to plan for three possible price movements: advance, decline or sideways. Have a plan for all three scenarios BEFORE making the trade. Consider possible holding times. And finally, look at overall market conditions and sector/industry performance.

About the author:
Arthur Hill, CMT, is the Chief Technical Strategist at TrendInvestorPro.com. Focusing predominantly on US equities and ETFs, his systematic approach of identifying trend, finding signals within the trend, and setting key price levels has made him an esteemed market technician. Arthur has written articles for numerous financial publications including Barrons and Stocks & Commodities Magazine. In addition to his Chartered Market Technician (CMT) designation, he holds an MBA from the Cass Business School at City University in London.
Learn More