Art's Charts October 26, 2023 at 10:53 AM
Correlations rise during bear markets. This means more stocks participate in broad market declines than broad market advances. In other words, the odds are stacked against us when picking stocks in bear markets... Read More
Art's Charts October 18, 2023 at 09:27 AM
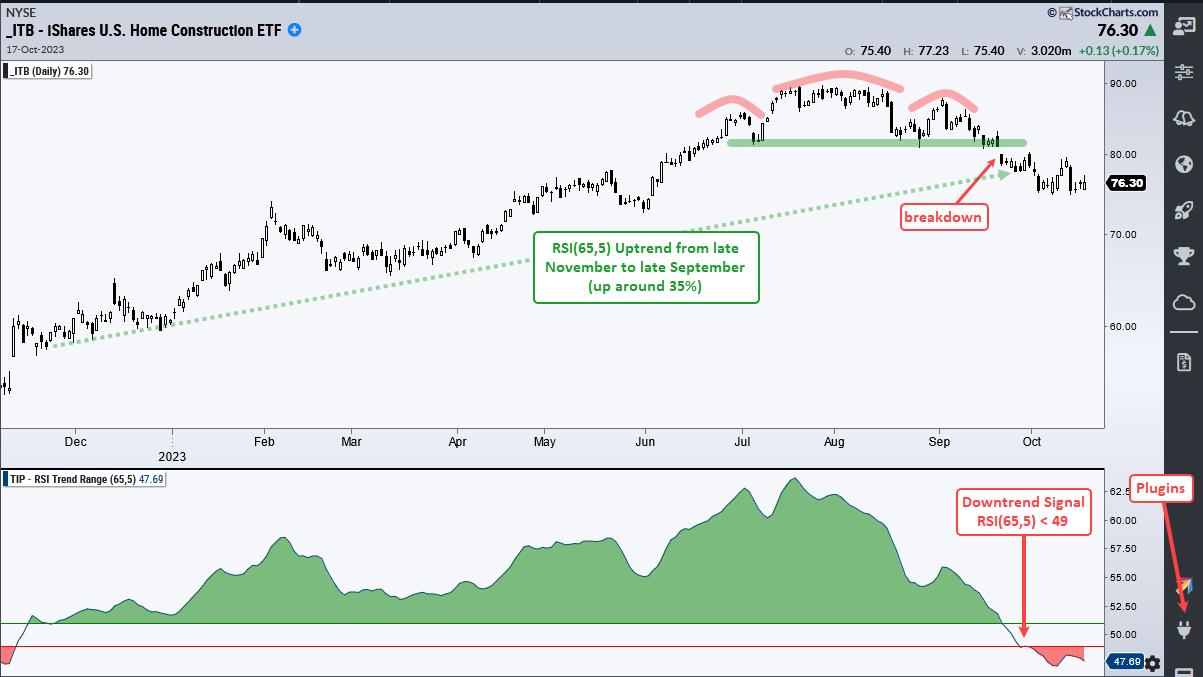
The Home Construction ETF (ITB) led the market the first seven months of the year, but fell on hard times the last two months and reversed its long-term uptrend. Today's report/video will look at the trend reversal in ITB using the RSI Trend Range indicator... Read More
Art's Charts October 16, 2023 at 09:32 AM
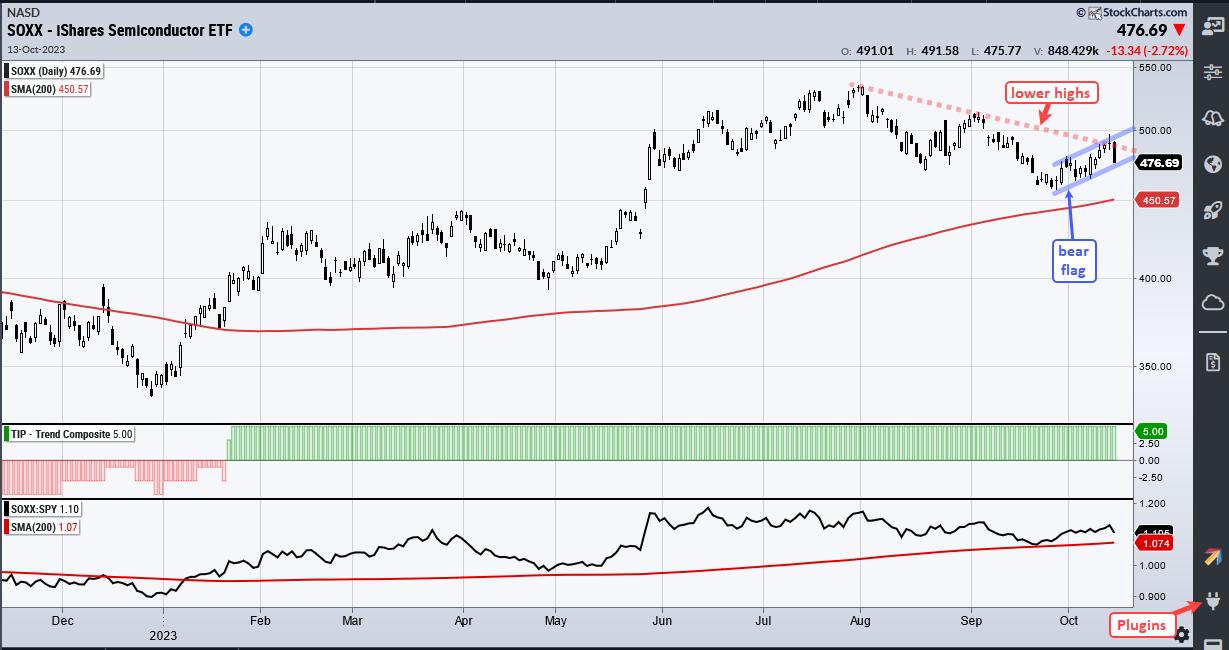
Today's report will compare charts and performance for the Semiconductor ETF (SOXX) and the Semiconductor SPDR (XSD). SOXX represents large-caps and is holding up. XSD represents the average semiconductor stock and it is not holding up... Read More
Art's Charts October 12, 2023 at 01:42 PM
Despite a rough ride in September, the S&P 500 is still up 14% year-to-date and the Nasdaq 100 is up a whopping 40%. The gains here, however, do not tell the entire story because many stocks are struggling in 2023... Read More
Art's Charts October 10, 2023 at 10:47 AM
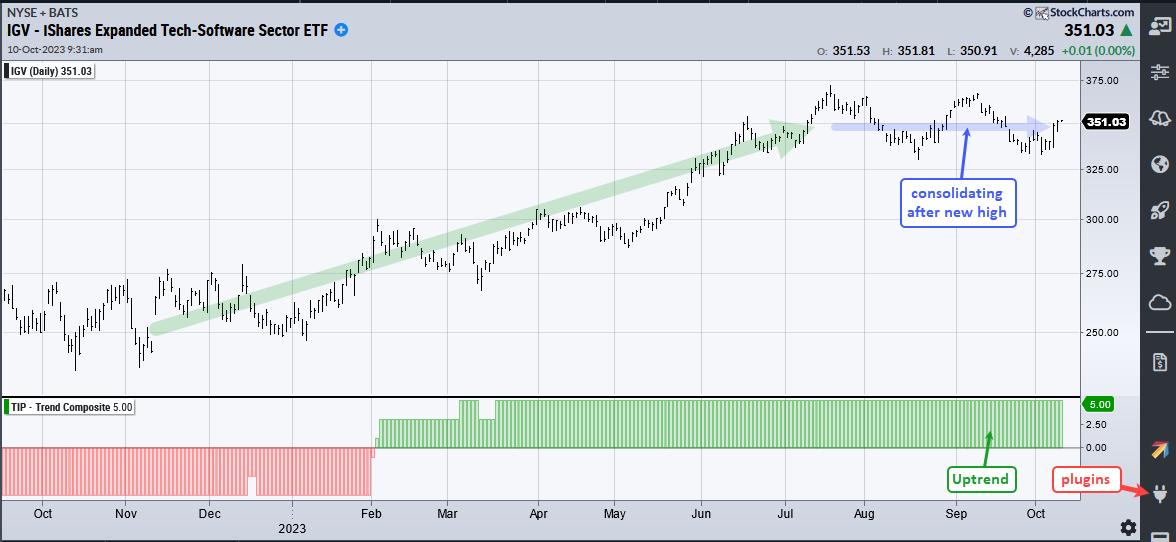
Chartists looking to get the jump on a bigger breakout can turn to the swings within a developing pattern. For example, a Symmetrical Triangle after an advance is a bullish continuation pattern. We can get the jump on a breakout by trading a downswing reversal within the pattern... Read More
Art's Charts October 05, 2023 at 10:59 AM
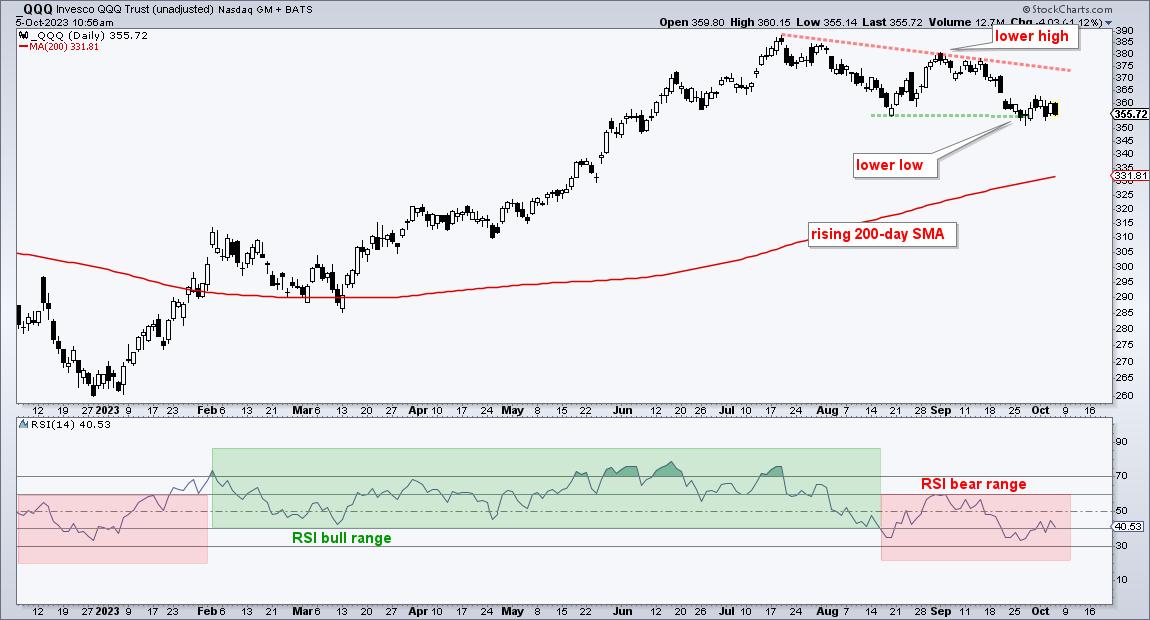
QQQ remains well above the rising 200-day SMA, but clearly shifted from bullish to bearish over the last two months. Today's report/video will show this momentum shift and analyze the short-term continuation pattern taking shape... Read More
Art's Charts October 03, 2023 at 10:46 AM
The pockets of strength are shrinking as more stocks succumb to selling pressure. The Nasdaq 100 is the strongest of the major indexes, while the Finance sector is one of the weakest sectors... Read More