First of all, Happy Thanksgiving to all our american readers and friends. May this celebration find you happy and healthy. This also includes all the staff at Stockcharts.com who do a great job!
+++++++++++++++++++++++++++++++++++++++++++++++++++++++++++++++++++++++
The US Bond market has befuddled the masses by continually pushing prices higher and the yields lower.
Without reiterating all the reasons this is amazing, let us start with one.
1) France credit spreads are blowing out and they still have a AAA Credit rating.
The US debt has been downgraded by S&P but the French have not.
But the cost to insure a French Sovereign debt is almost 400% more...
One of these things is not like the other....
Here is a link to the CNBC CDS rates page. Lets check out the market perception of these debt instruments from a default insurance perspective.
This is a little paragraph at the bottom of the rates giving the laymans definition of a CDS.
++++++++++++++++++++++++++++++++++++++++++++++++++++++++++
Note:
Credit-default swaps are derivative financial instruments that "swap" the credit exposure from one entity to another. In simple terms it is an insurance policy for an entity's debt obligations. The buyer of the swap holds the insurance, while the seller takes the risk. The listed number is the price, in thousands, to insure $10 million in debt.
Although the markets for such instruments are somewhat illiquid, the prices and their movements are used by some to gauge the perceived creditworthiness of a particular entity, in this case, the sovereign nations listed above.
+++++++++++++++++++++++++++++++++++++++++++++++++++++++++++++++++++
In this inter-related world, the FXE - (Euro/US Dollar currency pair) seems to push each lever across all asset classes from bonds, commodities, stocks, and other currency pairs. We see this stalemate in the credit ratings of France and Germany, but the US has already being downgraded.
However, almost as polar opposites, we see the relative safety of the US repayment to be considerably less risky than the French or German bond equivalents.
In simple terms,
the French insurance cost is above $200,000 for $10M
the German insurance cost is above $100,000 for $10M
the USA insurance cost is above $50,000 for $10 M
The super committee was unable to come up with a package to contain the explosion of US goverment spending.Would that put more pressure on the US bond market? I think it is timely to watch the bond market response after the super committee was unable to progress on the US Debt. If the US 'ability to pay' has been downgraded by S&P, it should start showing up in the CDS rates listed above, as the market perceives the problem getting bigger.
So I want to watch what happens to the
30 year Treasuries $TYX,
10 year Treasuries $TNX.
5 Year Treasuries $ FVX,
2 Year Notes $UST2Y
1 Year Notes $UST1Y
3 Month Notes $IRX
All of the above are expressed as yield. So as the price rises the yields fall. If the markets perceive less value in these investments, the price will fall causing the yields to rise.
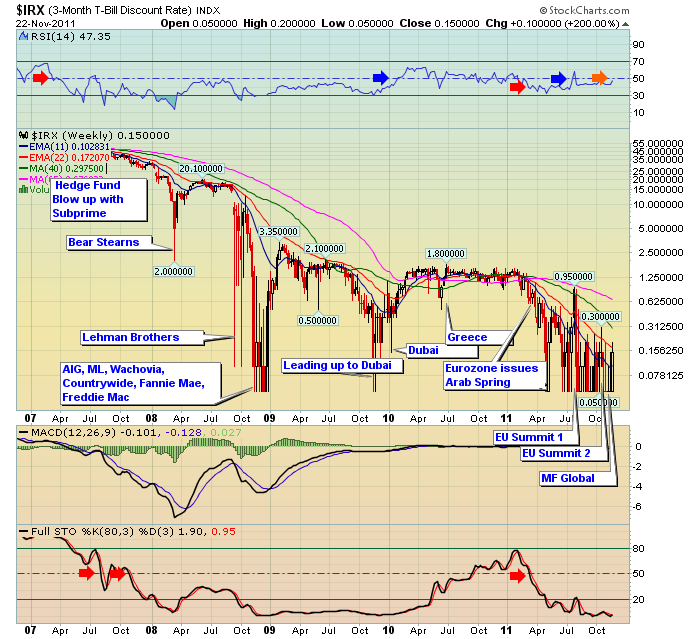
I have found the 3 month $IRX to be super sensitive and a good indicator for a long time. As it continues to bang upon the zero line, it's value as an indicator has dropped. We had to move to longer time lines like the 6 month or 1 year. But should it start to surge to the upside, our rabbit ears should pop up!
Here is the 3 month IRX.
Recently, the 3 month surged to the upside and the RSI went into overbought on the daily. It has only happened once a year in the last 3 years. So, maybe a trend change to see the "yield" chart going into overbought in the middle of all this Eurozone debt problems would be an indicator for us to use. That means prices paid surged to lows and yields pop higher.
What I interpreted was that the fortress of the US debt market may start to see some upside pressure. Nothing dramatic, but a trade I'd like to participate in if it was to start rising quickly.
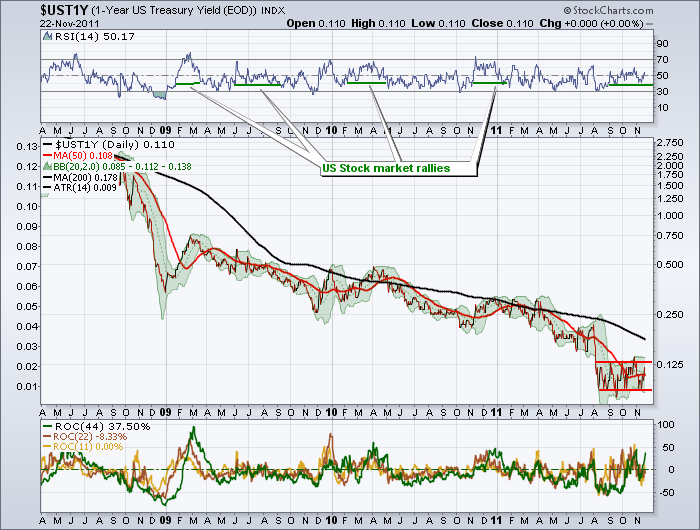
Let's look at the 1 year. $UST1Y
So the trend in the 1 year has definitely been a sideways pattern near zero. It is still contained in this pattern. It may hold here for days, months, weeks, years. But the longer the base, the higher the space when it moves out of the base. We'll keep watching the 3 month and the 1 year for hints.A dashboard could help as well.
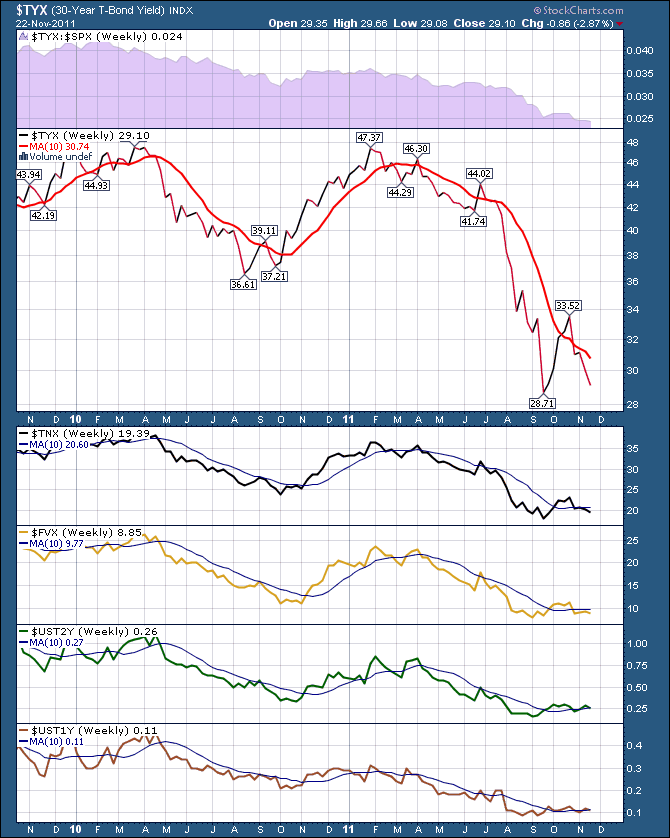
Here is the bond dashboard.
I notice a slight upward skew on the 1 year, 2 year, and the 5 year. Today, they are all back below the 10 week.
Just another chart to keep watching! The bond market can start to move in a different direction than the equity markets at totally different times.
The interesting part about this trade is you could see it working in 2 scenarios.
Everybody gets concerned about US debt which pushes prices lower and yields higher. This would probably pair with a stock market becoming concerned as well, pushing prices lower.
or
The Stock market takes off to the upside and the bond market has a massive withdrawal of funds from the bond market into equity markets. This would also drive prices lower, yields higher as you can see on the 30 year treasury in the last few months. The change in price and yield were tremendous for a 30 year bond!
Conversely if it stays in here, it probably indicates a desire to remain in treasuries as the global scenario unfolds in a downward trajectory. Safety in the largest bond market sounds safer than parking elsewhere.
To me, it still says safety is here in the US bond market.
We have Ed Carson speaking to the Calgary chapter of the CSTA in December. Should be some great stuff and more clues from a senior market watcher! Guests are welcome!
If you would like to subscribe to this blog, follow the link and click subscribe in the top right hand corner.
Good Trading,
Greg Schnell, CMT


