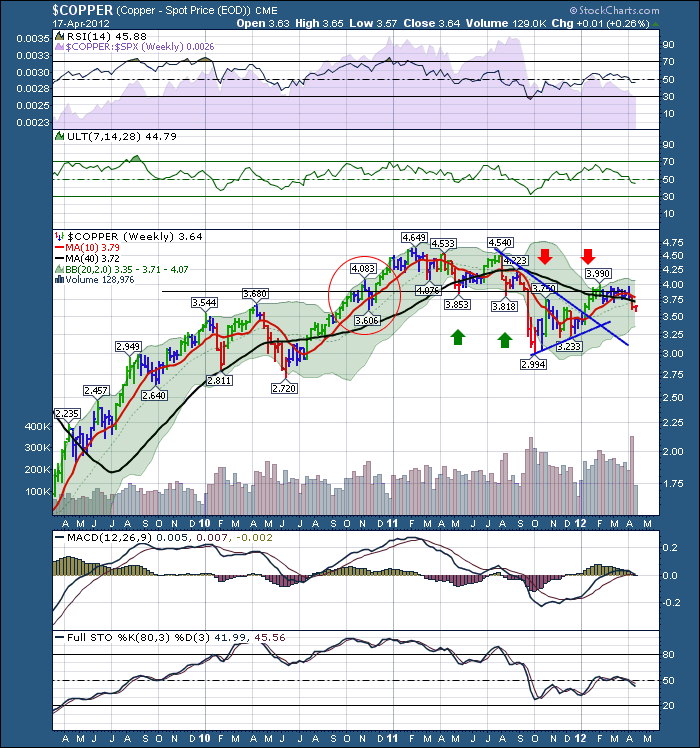
I keep looking for some commodities to get a little love but this $Copper one keeps hurting the most. When I posted in January it went on a tear the very next day.... We'll see if it can get some love after this post!! The real disappointment in the mega rally today was copper moved up one cent after a horrific week last week.
Keep your eye on Dr. Copper. He seems to know more than the talking heads.
What bothers me the most about this chart is the MACD rolling over at the zero line, the RSI dying after trying to break through 60 and failing to do so. It can always turn around, but a weekly RSI on $COPPER failing here is a poor omen of strength. It needs some sort of resurgence. I am not surprised to see a bounce in stocks during the earnings period. The markets are now trying to hold onto the 50 DMA.
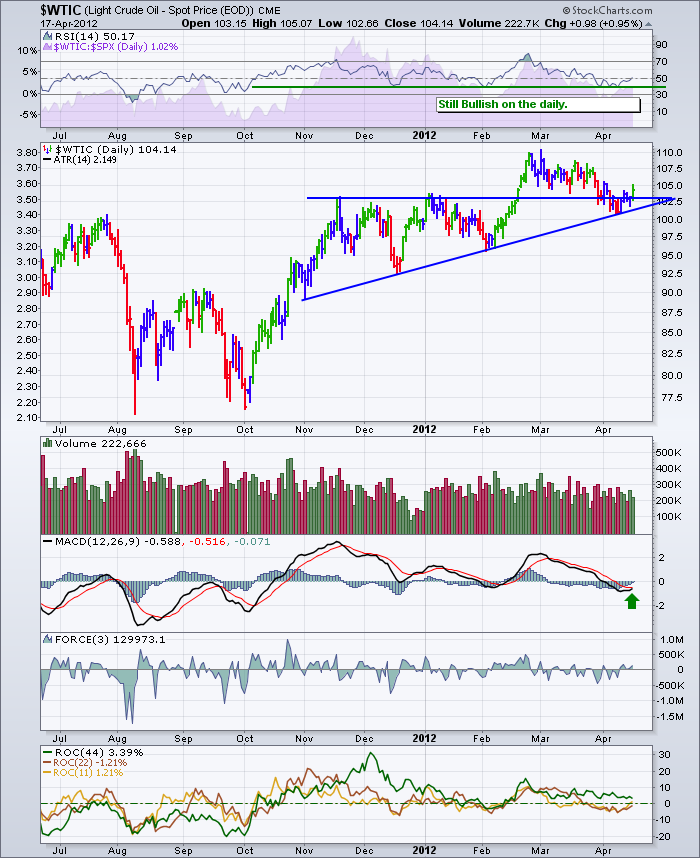
For all of the canucks reading the blog, we are watching crude closely.. Here is the $WTIC. 10% of Canada's federal revenues come from the Oil Sands. A main driver of Canada's national financial budget.
WHile the daily got a nice bounce today, you can see the last 6 weeks have made a nice downward channel. This needs to break to the upside.
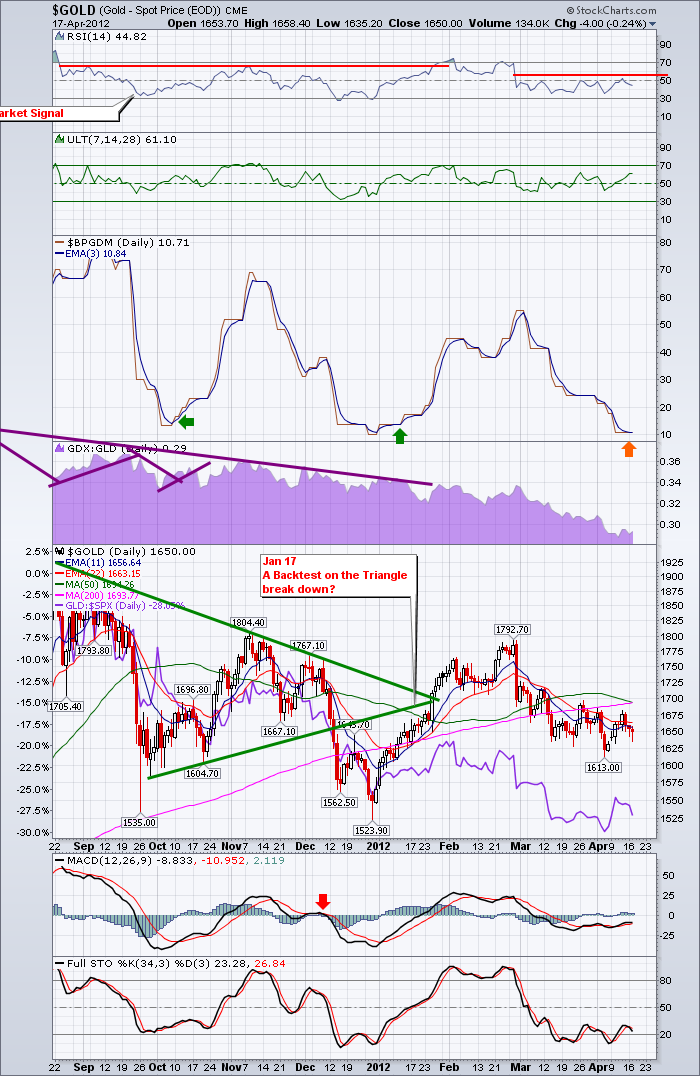
$Gold continues to dither. Hard to invest in the momentum when it doesn't have any. My tendency is to be bearish on this but the Bullish Percent index is at an interesting Buy level. Here is the gold chart with the Bullish percent index and the GDX:GLD ratio. Both are great places to look for a renewed interest in $GOLD. It doesn't look ready yet. But...tomorrow marks a new data point.
If the USD gets strength its hard to bet on the $GOLD chart moving higher. As you can see from these commodity charts above , none of them are really pushing higher in a nice uptrend compared to the rallies in US equities. I recently read a blog that said $natgas was more in tune with the real economy. While I think that is overplayed, it is hard to find a lot of commodities going higher which is very concerning. A few uranium stocks were on the top 10 SCTR scans from Stockcharts Canadian list today.
Stay very tuned in over the next 2-3 weeks. This is when the markets were breaking down last year and in 2010. April 19, April 26th and May 2 were all important dates in the last few years in the US markets. Be conscious that the main indexes have 75% of the stocks follow them up or down. The other 25% can outperform either way.
I see there are still a few spaces left for Chartcon in August. The room full of gurus would be remarkable at a price well north of here. It is just hard to get this level of talent at one venue. John Murphy is an absolute leader in Technical knowledge and he plans to share some great insights to his market analysis. That alone could feed our trading careers and would always be a significant premium. There are a host of great speakers. This will be extremely valuable and even more so with the software to track what they think about. Some conferences are hard to value. This one seems to be another gift to stockcharts members as the Chartcon 2011 was. If your on the edge, you won't be disappointed. Let's pack the room! I'll see you there.I hope to learn more from the speakers and the group at large. You can never stop learning in this field.
Good Trading,
Greg Schnell, CMT


