In this chapter about the SCTR, I want to discuss how one might use the SCTR to find sweet spots. There are multiple styles that investors can use. I will show three, then focus on one.
Just a brief recap so everyone is on the same page. When a stock moves above an SCTR of 51 it is behaving better (technically speaking) than 50% of the stocks within the group. So an SP500 stock with an SCTR of 51% is just above average. A stock with an SCTR above 75% is better than 75% of the stocks in the SP500. If we move to the ETF's , the same rule of measurement applies but it is only better than the other ETF's in its SCTR group and has no correlation with the ranking of the SP500 stocks. So it will be compared within SCTR.US.ETF. In Canada, all the Stocks and ETF's are in one group as Canada is smaller. The SCTR.TSX group would be used for Canadian stocks and ETF's.
So let's look at a few stocks. Just some quick pictures.
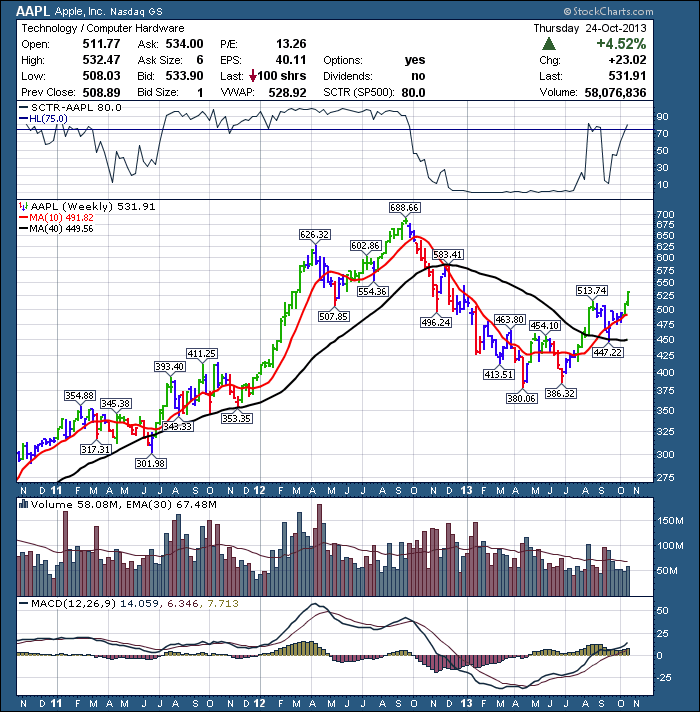
Here is AAPL. We all know the wild roller coaster on this stock over the past year.
OK. AAPL makes a nice example due to the recent move in the stock. If you look up at the SCTR line, you will see starting in July 2011, AAPL made a move and had an SCTR reading above 80. It stayed up there for 15 months or 5 quarters. Then it stayed under SCTR 10 for almost 9 months. It made a brief surge above 75 (the Blue Line) and then fell back. It closed today at 80.0 on the nose. You can see the SCTR group and the Ranking level in the full quote box at the top. SP500 and 80.0 . So as of today, AAPL moved back above the top quartile minimum and into the top 20% again. This is extremely bullish. My analysis says stocks trading between 75 and 80 should be watched closely. Once they get above 80, institutions like to invest in them because they have stocks that are leading and outperforming the performance of the index. This success starts to show on the other ranking systems that non technical people use. So success gets more investment. Apple looks today to be right at the entry into the sweet spot. Looking at the price action, it is just coming out of a cup with handle base and moved into the highest price of the year. Nice! Does it need a stop below? Depending on your trading style, but that is how you can control your risk.
In my analysis, when symbols are above 75, they are on the watch list and above 80 they are strong contenders for more institutional money. As we work through, you may like to watch that area.
The other thing to watch, is when they finally get back above the 10% level after being below. But weak stocks can stay weak for a long time. This is for more aggressive traders. If you look on the far left, when the SCTR oscillated around 50, it was correcting. Even though AAPL was not losing as much, it was an interesting place as the stock had no momentum higher. Once it broke SCTR 80, it was beautiful. The stock still oscillated back down to $343, so it was not pain free. But institutions were still buying it. You may remember the ~20% drop in the $SPX in late July and the ultimate low was Oct 4 that year for the $SPX.
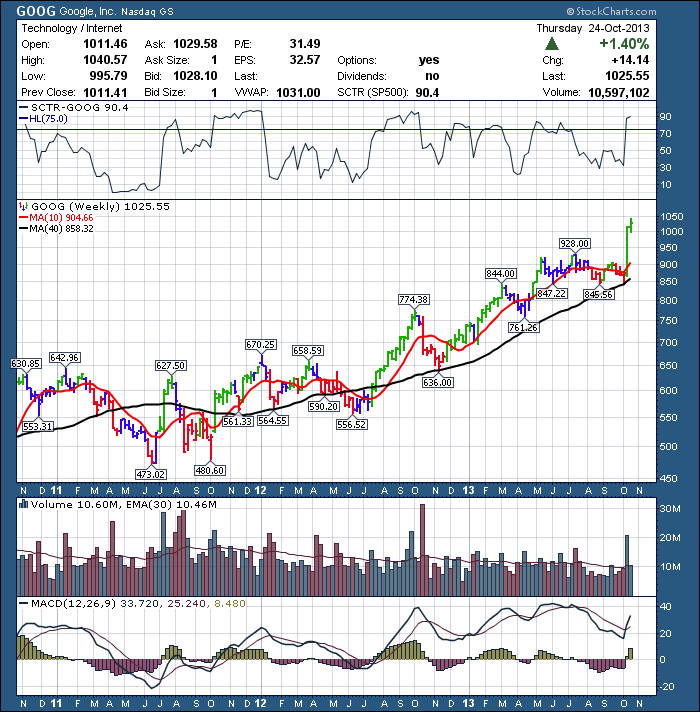
Here is GOOG.
GOOG has been a great story stock, but difficult to hold based on the SCTR ranking. Recently, GOOG had gone sideways for 6 months, so the SCTR rank was down to 30-50. This weeks earnings pop has got it back up in the sweet zone.
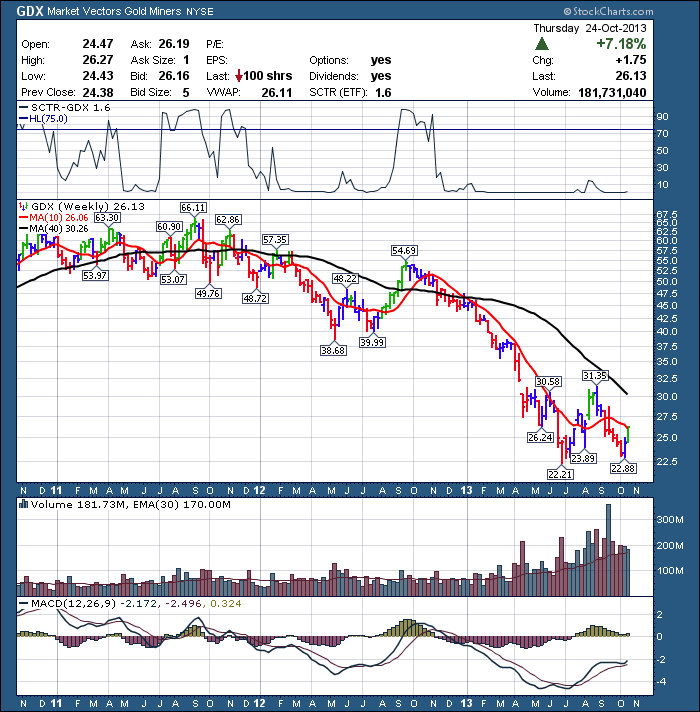
Here is the Gold Miners ETF. Notice the name change in the Full Quote box from SP500 to ETF.
Just staying with ETF's above 80 would have kept you out of this for most of the slide. Playing the bounces off the floor would still have been difficult. The Positive Divergence on the MACD makes GDX look very tempting for bottom fishing. You won't have a lot of institutional support. Can it run? Absolutely. My interpretation is the SCTR suggests this needs more time for institutions to jump in.
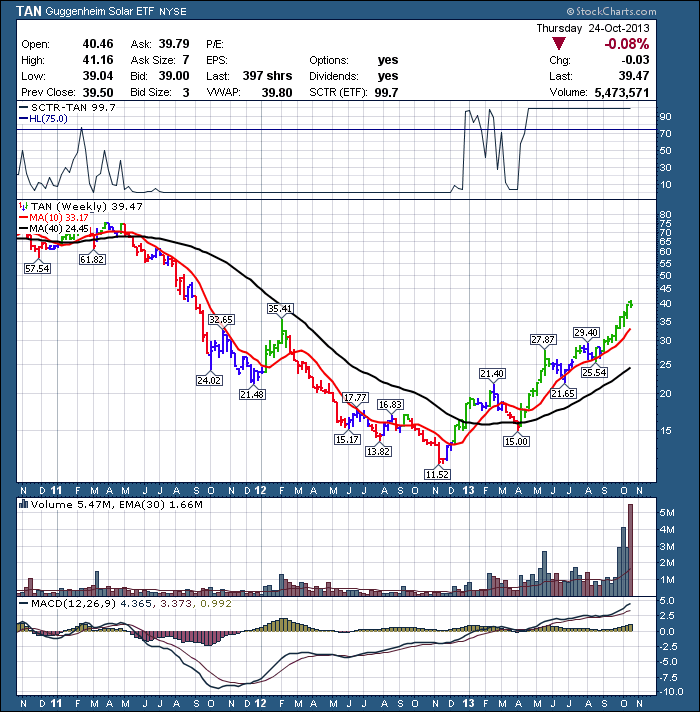
Here is the TAN ETF for Solar stocks.
A Breakout above 75 as it crossed above the 40 week MA was the big move at the end of the 2012 year. Then, a pullback down to the 40 WMA again. After enduring an almost 8 week pullback in Feb/Mar/Apr, the solar ETF took off. The SCTR burned above 80 and has laid on the SCTR Tanning Beach at 99 for 6 months. A double on the price action.
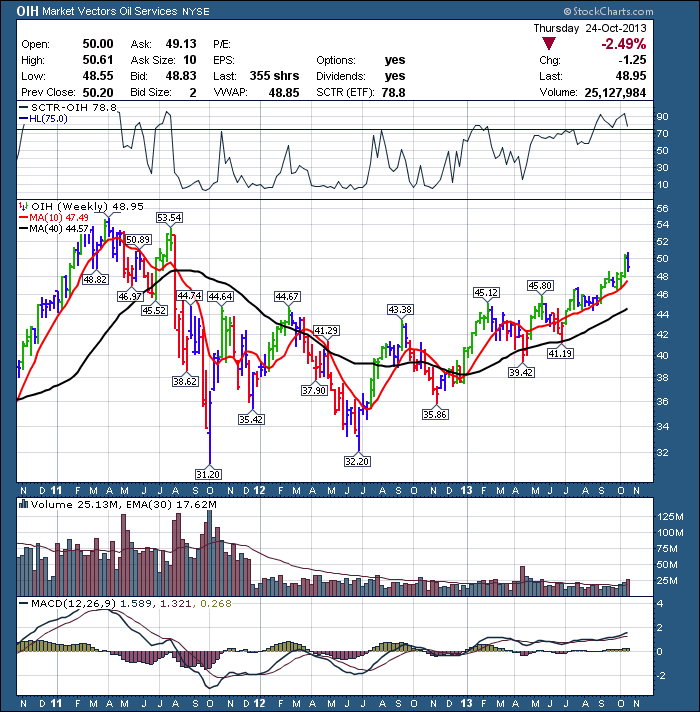
OIH recently pushed back above SCTR 80.While it was below 80, it was chopping around and wore out the bulls and the bears. The move above 80 on the SCTR has also seen a move of 10% in the price so far. Notice how the break above 80 on the SCTR, was also the break above previous resistance for the last year. You can see the previous breaks above resistance in Feb and May had lower SCTR scores and failed to hold. A position at that time would have been hard to hold. It tried to break above 80 in February but failed.
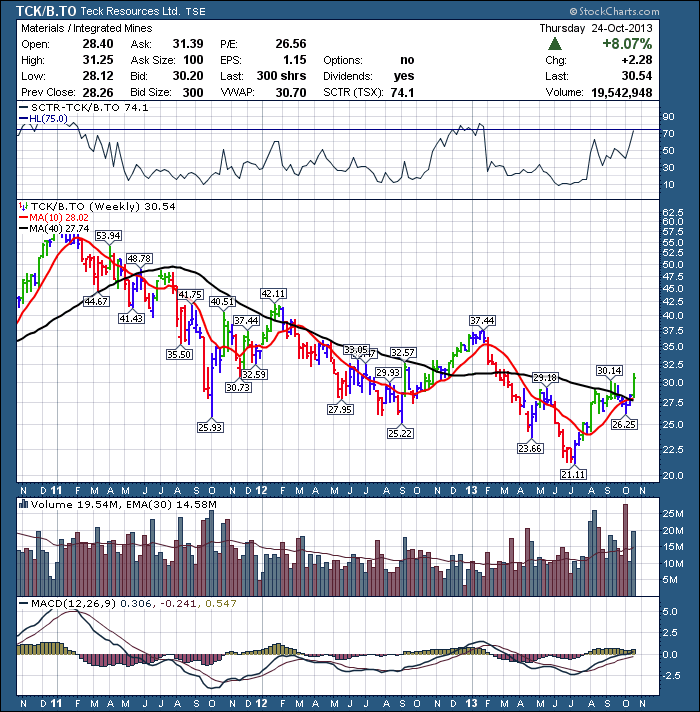
Here is a Canadian Mining stock that reported earnings yesterday. Teck Resources.
This morning when I scanned, Teck was just above the 75 level. It pulled back to close at 74.1. Notice how the SCTR ranking is perking up, just as Teck breaks above a Head/shoulders basing pattern. The measurement would suggest a $39 price target. We will still have to see if it can break into the 80 area.
Let's do one more.
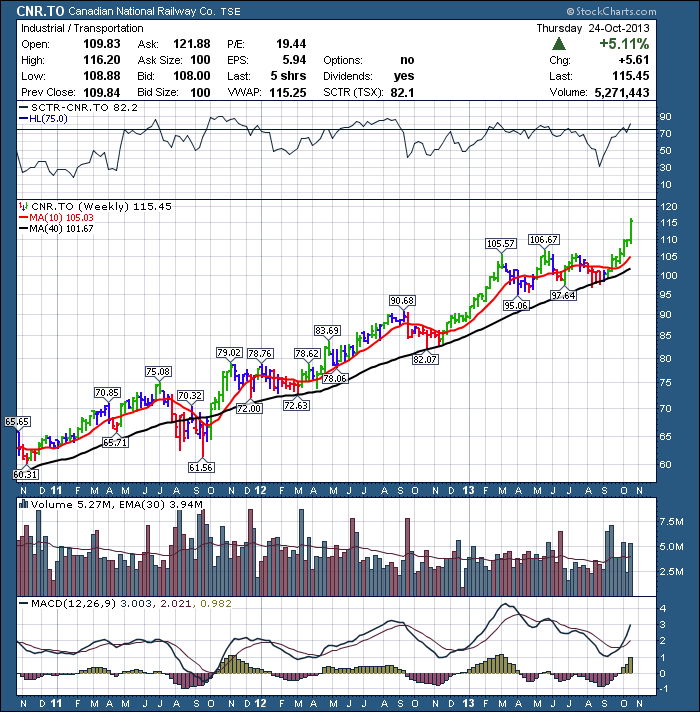
I blogged on October 9 that the Canadian rails were breaking out above 2013 resistance. The SCTR scan was above 75. So this is a really interesting place to look at the rails as the SCTR moves above 80.
That is a brief look at how I have been using and analyzing the SCTR. After reviewing 100's of charts, this would be my summary for using the SCTR.
Bounces above 10 are trades, but they are hard work.
Stocks in the middle around 50, wear out the bulls and the bears.
Stocks above 75 are interesting. The institutional buying really perks up at SCTR 80. This number has to be a little higher on the SCTR.SP500 because of the quality of the stocks. They are very good companies.
Now that we have some areas of interest, we need to write some scans to bring these stocks to our attention in a timely manner. With scans, we need to have some chartlists to put scan results in.
So next we will discuss setting up some chartlists with naming conventions that fit into the stockcharts default. If you are a member, click on the 'your account' tab on the top right. If you have already downloaded the 'Stockcharts Essential ChartPack', you will be able to install the chartlists we create tomorrow so they fit within that grouping. If not, you may wish to do that. We will be placing some charts in the 'Watchlist' Area. To tell if you have it installed, on your 'Member' tab near the bottom, should be a chartlist with this title.
We will add some chartlists in that area.
Thank you for those who have taken the time to shoot me an email with questions or clarifications on this blog series. Hopefully I've demonstrated where we can use some SCTR filters to help find strong stocks. Now we get into how to make the process of trying to create some optimal scans!
Good Trading,
Greg Schnell, CMT

