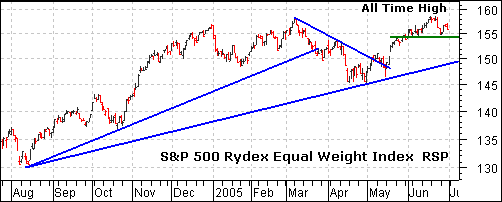
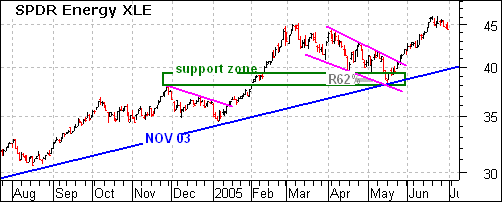
The Rydex Equal Weight S&P 500 Index (RSP) moved to a new all time high last week. Strangely enough, the Energy SPDR (XLE) moved to a new all time high two weeks ago. It is clear that Energy stocks have the best of both worlds: rising demand and rising prices. When will it end?
If you consider the stock market a leading indicator, then the economy must be in pretty good shape and demand for oil is robust. Should the stock market fall sharply, it would suggest an economic slow down and this would affect the demand for oil. It stands to reason that the Energy sector will remain strong as long as the broader market holds up.
The correlation between XLE and RSP has been quite strong since August. RSP advanced from August to December and XLE advanced from August to November. The Energy SPDR (XLE) had an extra leg up in January-February and then both corrected in March and April. RSP bottomed at the end of April and XLE soon followed with a bottom in May. It stands to reason that Energy will remain strong as long as the broader market (economy) holds up.


