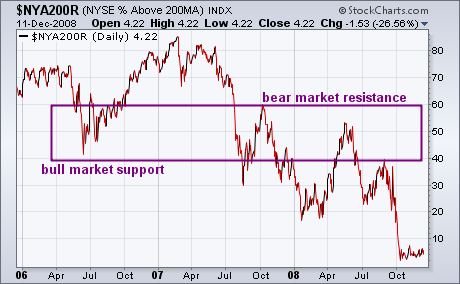
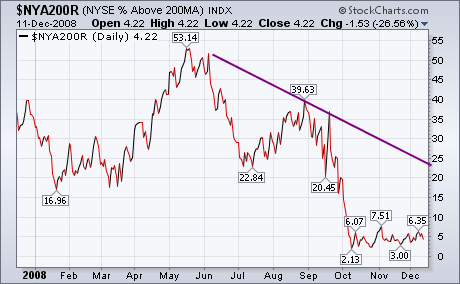
A reliable measure of the market's strength or weakness can be found in the % of NYSE stocks trading above their 200-day averages. That's because 200-day averages are used to measure a market's long-term trend. [A 50-day line measures short- and intermediate- market trends]. Chart 1 shows the indicator since the start of 2006. The sharp drop during the second half of 2007 was one of the bearish signs that warned of a coming bear market. During bull market corrections, the indicator will often pullback into the 40-50% region. The April 2006 bull market correction bounced from 40%. Drops below 40% signal the start of a bear market which occurred during the second half of 2007. Bear market bounces can rise into the 50-60% region. The April/May bounce rose to 53% before turning back down again. The August bounce failed at 40%. A reading above 60% is normally needed to signal a new bull market. Chart 2 shows the trend during 2008 which is still very low 4%. That means that 96% of NYSE stocks are trading below their 200-day lines. While that historically low reading reflects a deeply oversold market, it doesn't show any sign of turning higher. Remember that the stock market is a market of stocks. The market can't be expected to rise much when the overwhelming majority of its stocks are still in major downtrends.