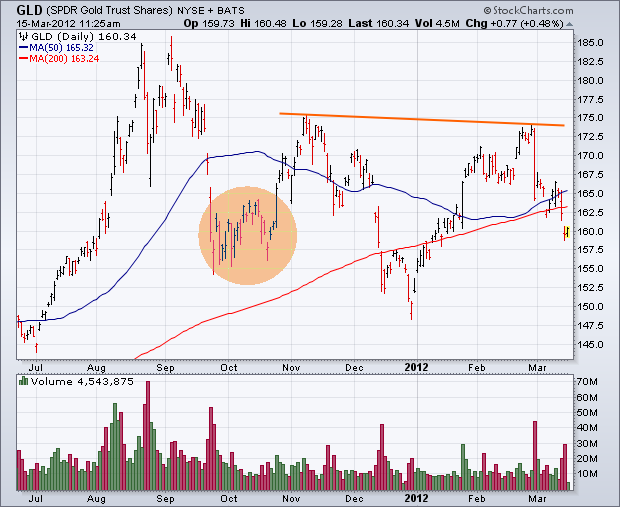
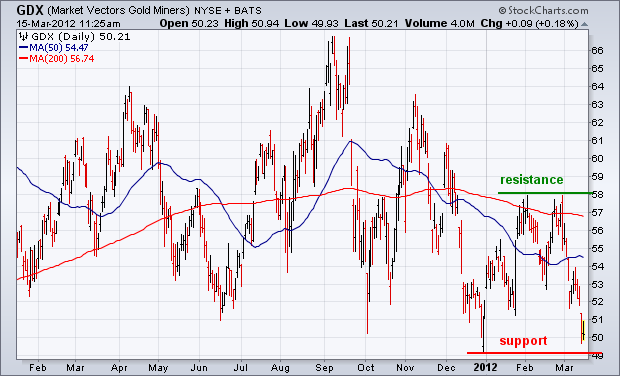
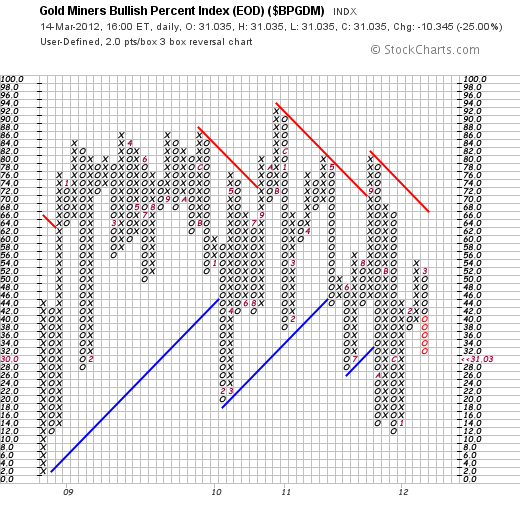
A couple of weeks ago (February 28) I wrote a positive article on precious metal assets. The entire group has taken a big hit since then. Two contributing factors have been more positive comments from the Fed, which imply little or no more quantitative easing. That pushed U.S. bond yields sharply higher earlier this week and gave a big boost to the U.S. dollar. Stocks also rallied sharply. That combination pushed gold prices sharply lower, and gold miners along with it. Chart 1 shows the Gold SPDR (GLD) tumbling to a two month low on rising volume. It has also fallen below its 200-day moving average. Even with that short-term damage, however, the GLD chart doesn't look that bad. A possible "neckline" can still be drawn over its November/February highs. That makes the current selloff a potential "right shoulder" in a bottoming pattern. The circled area shows potential chart support formed last September and October (the potential "left shoulder"). The price of gold needs to stay above that support zone to keep any bullish hopes alive. Eventually, GLD will also have to break the "neckline" to actually turn the chart bullish. Gold miners have fallen along with bullion. Chart 2 shows the Market Vectors Gold Miners ETF (GDX) falling into a test of its December low. A couple of weeks back it was testing February resistance at 58. It failed that test of resistance. The question now is whether it will survive a test of support. The February 28 message also showed the Gold Miners Bullish Percent Index ($BPGDM) on the verge of a point & figure buy signal. Chart 3 shows the p&f buy signal taking place at 46. That buy signal, however, has been negated with a new p&f sell signal at 36. Obviously, my earlier enthusiasm for precious metals has been considerably dampened.


