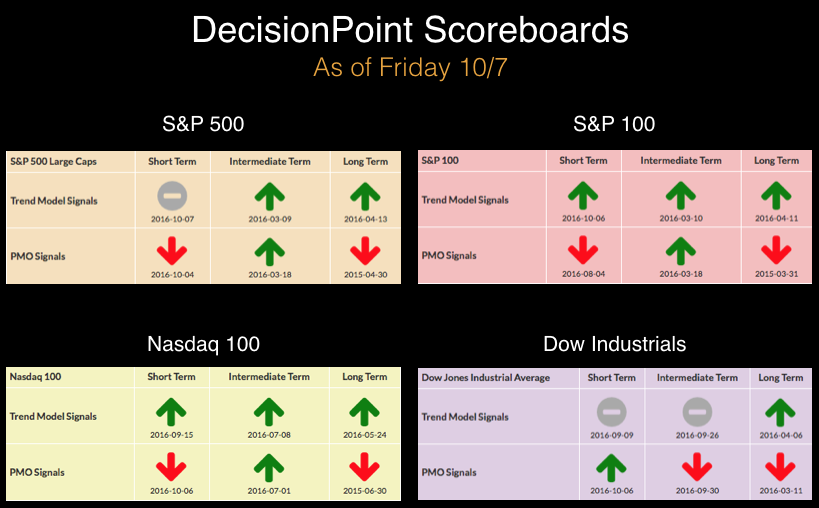
The DecisionPoint Scoreboards had significant changes this week. Note the difference between last Friday's DP Scoreboard and today's. Scoreboards went from very bullish to very bearish in one week. The intermediate-term BUY signals that were replaced on the SPX and OEX had been in place since March!
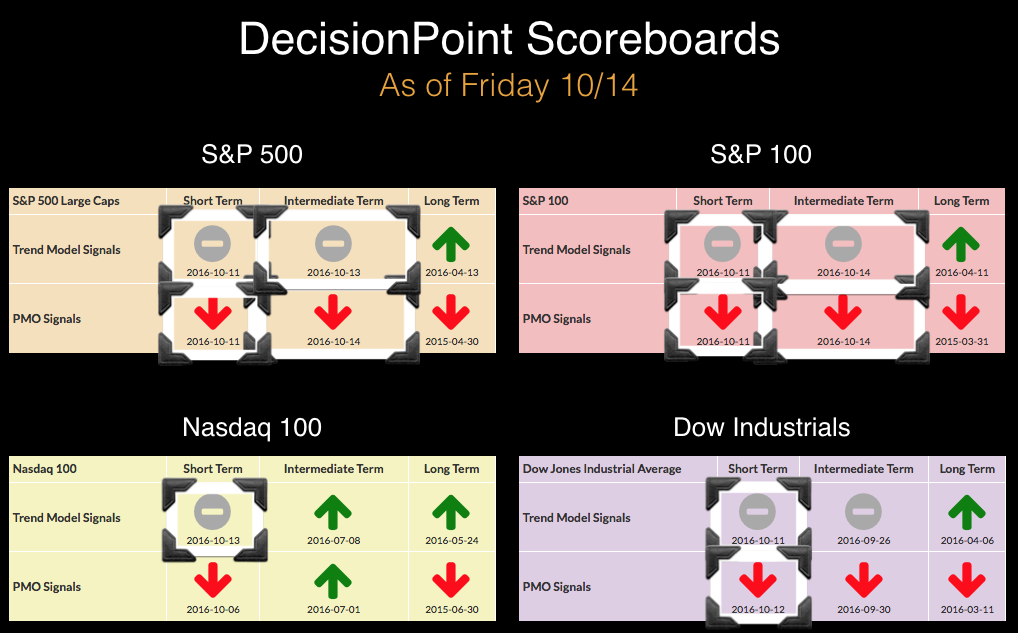
We've seen quite a bit of whipsaw on our short-term signals, but they seem to have settled in with the intermediate-term signals in the bearish position.
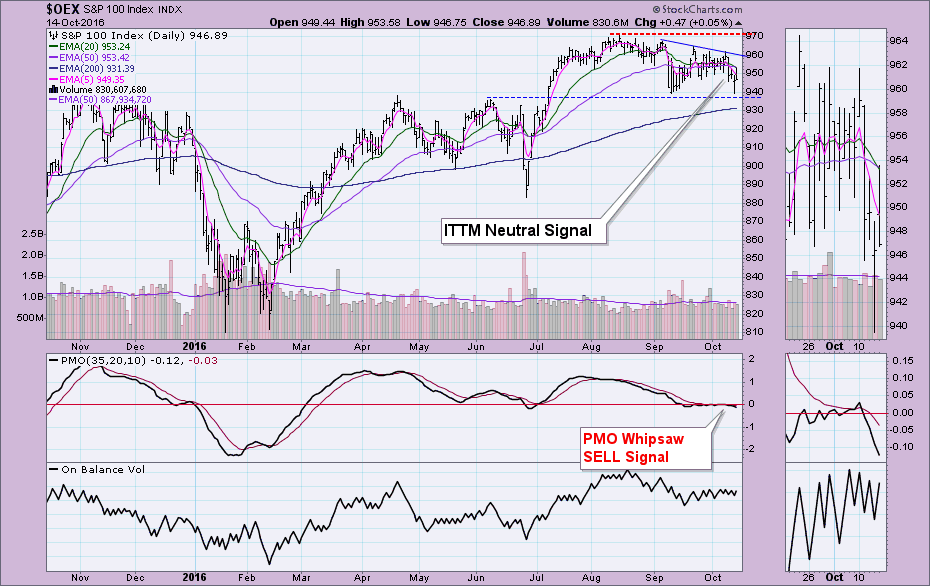
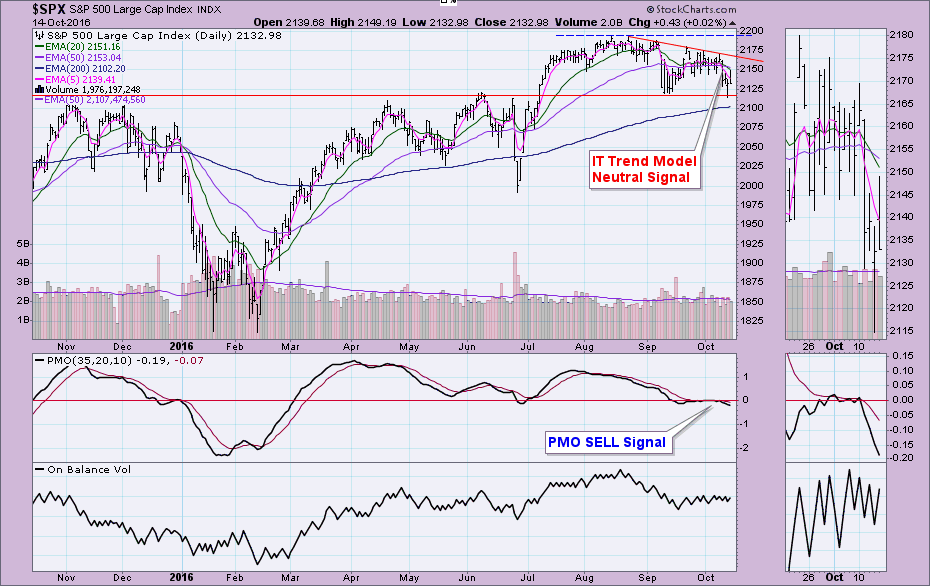
The Intermediate-Term Trend Model (ITTM) Neutral signals are generated by 20/50-EMA negative crossovers. They are "neutral" because the 50-EMA is above the 200-EMA which implies the OEX and SPX are in bull markets or have a bullish bias. The model won't go on a SELL unless the long-term shows a bearish bias. You'll notice on the daily chart both the ITTM and ST Price Momentum Oscillator (PMO) signal changes. The declining tops trendline suggests that bulls are losing steam. Support is holding for now, but the new bearish signals suggest it won't.
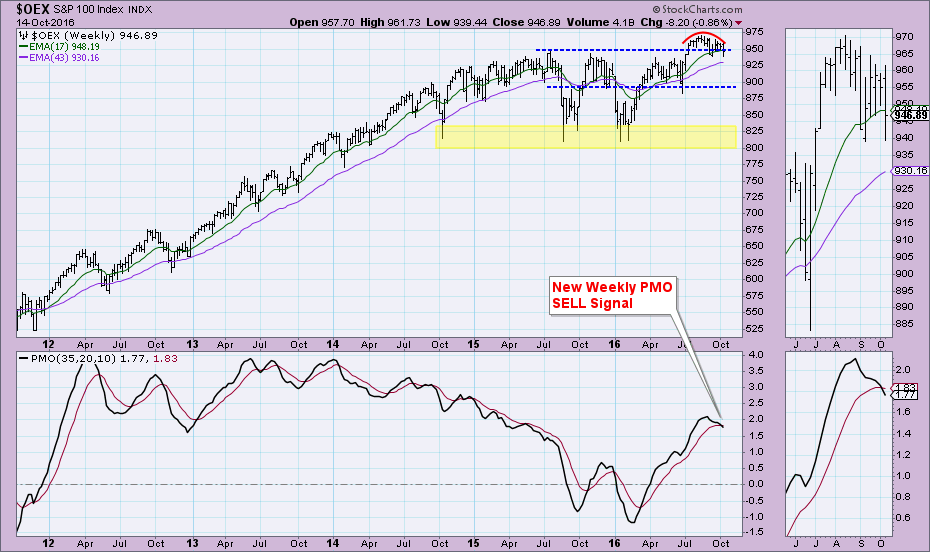
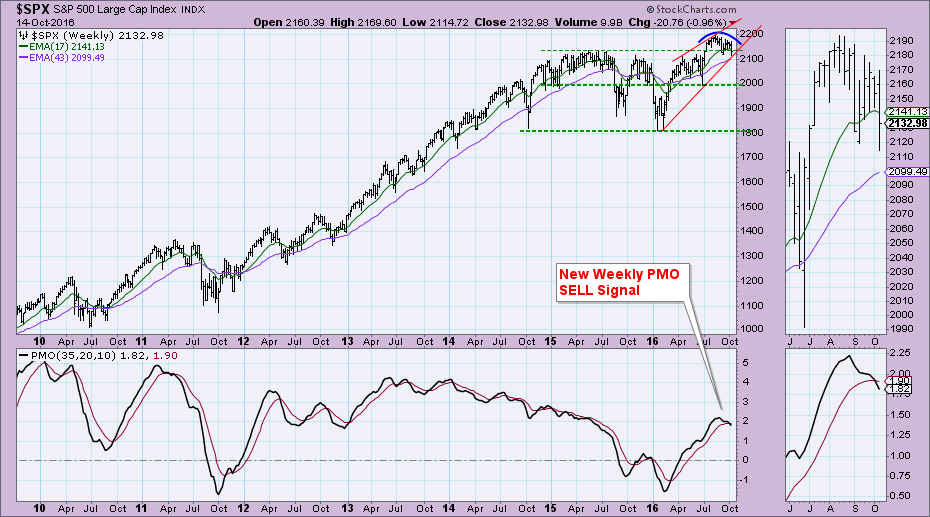
You'll find the new Intermediate-Term PMO SELL signal on the weekly chart. We don't get whipsaw on these signals and they tend to be very prescient. The rounded top and breakdown from support is bearish.
We have a similar configuration on the SPX. A declining tops trendline that is holding as overhead resistance and horizontal support. Combining the two and we see a descending triangle. This is a bearish formation that if executed would confirm the PMO SELL signal and STTM (negative 5/20-EMA crossover) & ITTM signals.
The weekly chart doesn't inspire confidence. A rounded top and a rising wedge are both bearish patterns and suggest more decline. You can already see the breach of horizontal support. The weekly PMO SELL signal is the most concerning.
Conclusion: It may seem that I'm always writing about signal changes and to some degree that is true given all of the whipsaw short-term signals. However, these ITTM Neutral and ST PMO SELL signals replace BUY signals that had been in place since early March--not even Brexit threw those signals off. I wrote today in the DP Alert blog that there is the possibility of a short-term rally right now based on short-term indicators, but the keyword is "short". Unfortunately, the intermediate-term signals have very bearish implications.
The NEW DecisionPoint LIVE public ChartList has launched! Click on the link and you'll find webinar charts annotated just before the program. Additional "chart spotlights" will be included at the top of the list. Be sure and bookmark it!
Come check out the DecisionPoint Report with Erin Heim on Wednesdays and Fridays at 7:00p EST, a fast-paced 30-minute review of the current markets mid-week and week-end. The archives and registration links are on the Homepage under “Webinars”.
Technical Analysis is a windsock, not a crystal ball.
Happy Charting!
- Erin
