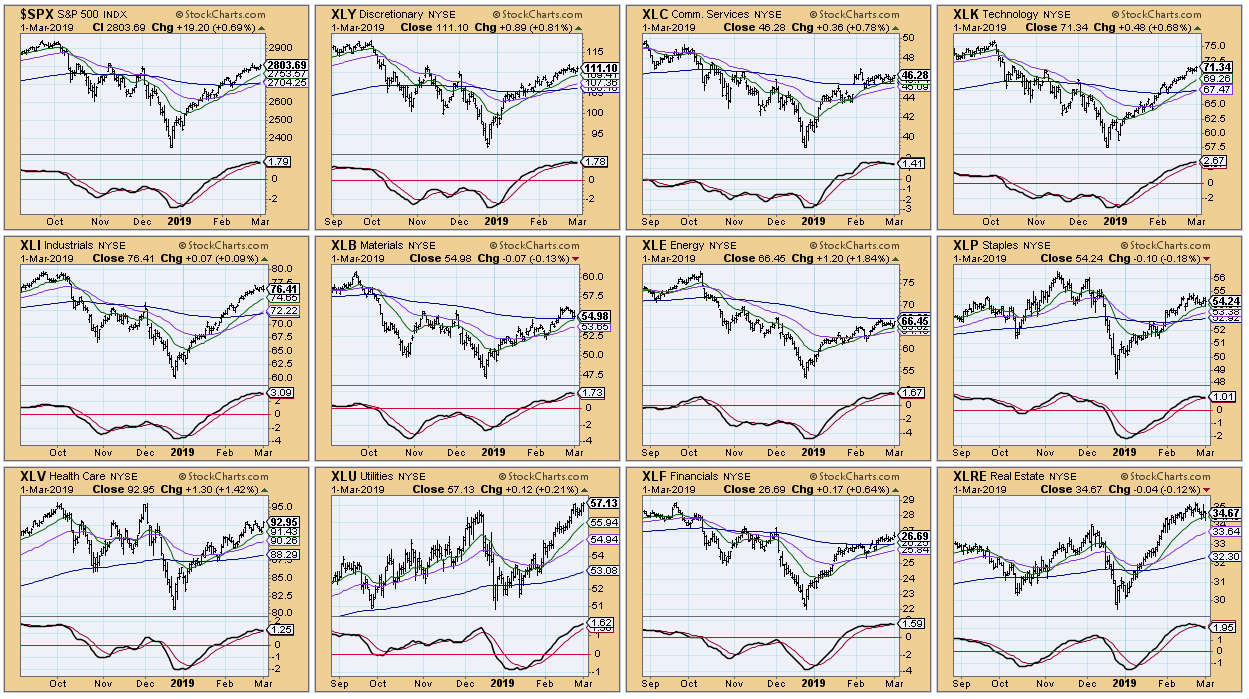
While comparing the relative performance of the OEX, IJH and IWM to the SPX, I found an attention flag. The market is very overbought, with momentum indicators rolling over in overbought territory. The same thing goes for all the sectors. A CandleGlance of the sector SPDRs and SPX are all in agreement concerning the PMOs decelerating and rounding into tops. The CandleGlance below strongly suggests a market top. Bright spots? Technology and Utilities have PMOs that are still somewhat rising.
Below is the chart you need to see. I looked at price relative and noted clear trend breakdowns and breakouts, which are marked where the market reversed in a big way. When mid- and small-caps are outperforming the SPX, rallies tend to continue. However, a negative crossover and subsequent underperformance mark the beginning of market downturns. Notice that the large-cap OEX tends to outperform in declines, but underperform during rallies. The reverse correlation is visible as, as mid- and small-caps outperform, large caps underperform. It almost looks like a mirror image. A breakout from the declining trend shows that large-caps are beginning to outperform the SPX once again. There is also a breakdown in relative performance by mid- and small-caps.
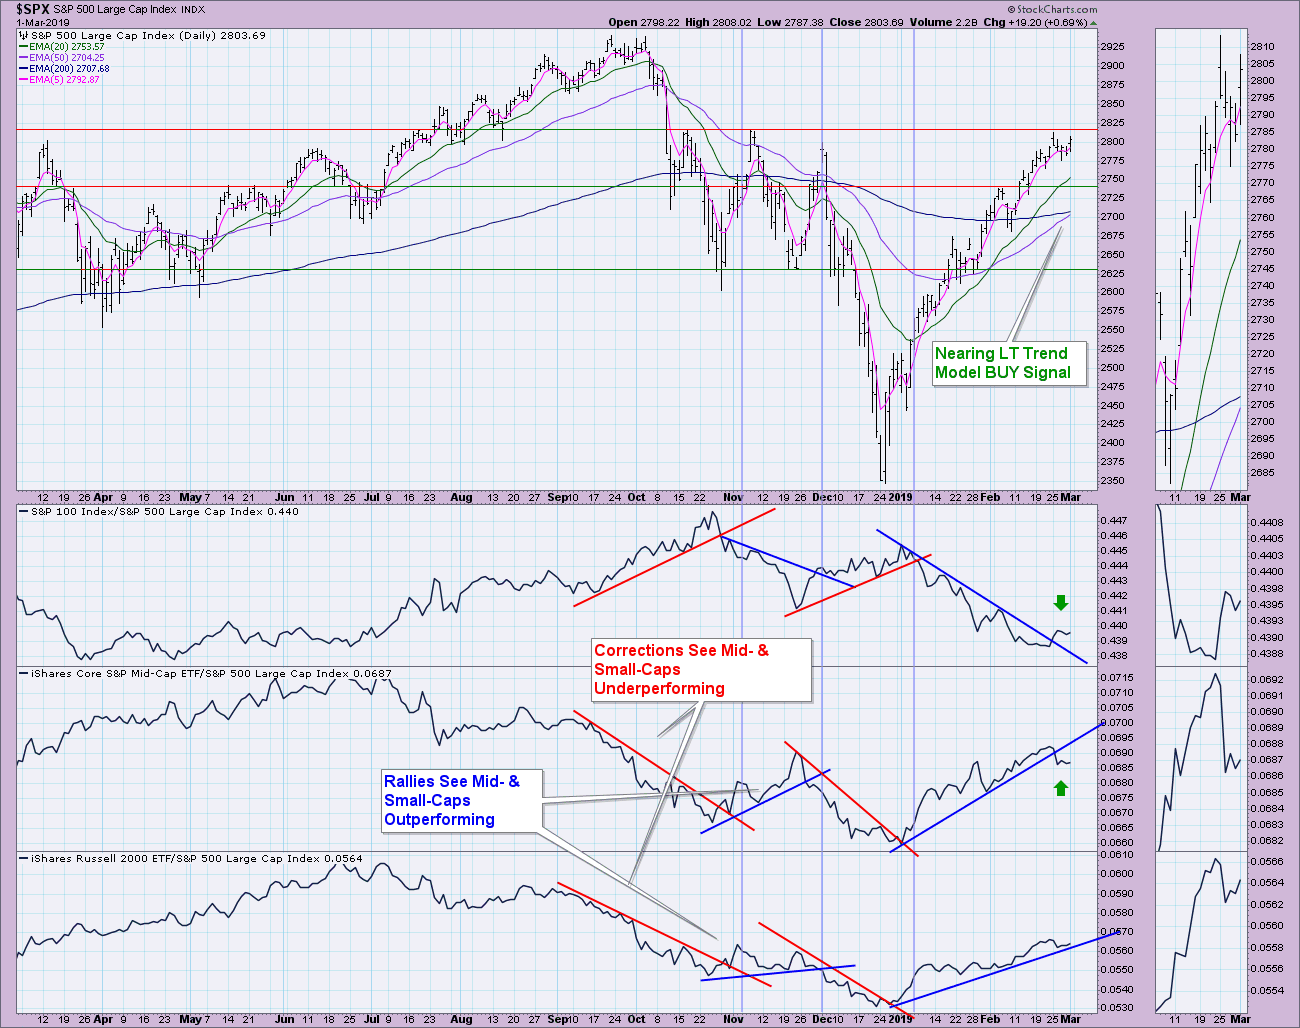
Conclusion: Despite an upcoming Long-Term Trend Model BUY signal on the SPX, I'm concerned in the shorter-term about the breakdown in mid-cap performance and the near-breakdown in small-cap performance, accompanied by a relative performance breakout by the OEX. Coupled with the PMOs that are rolling over across the sectors.... the technicals suggest a pullback at a minimum, but a correction seems more likely. The market is really overbought across the board - a correction is needed.
Watch the latest episode of DecisionPoint with Carl & Erin Swenlin LIVE on Fridays 4:30p EST or on the StockCharts TV YouTube channel here!
Technical Analysis is a windsock, not a crystal ball.
Happy Charting!
- Erin
Helpful DecisionPoint Links:
DecisionPoint Shared ChartList and DecisionPoint Chart Gallery
Price Momentum Oscillator (PMO)
Swenlin Trading Oscillators (STO-B and STO-V)
**Don't miss DecisionPoint Commentary! Add your email below to be notified of new updates"**
