As I have mentioned in the last three Market Roundup shows (which you can find here on the StockCharts YouTube channel), the Gold-related charts have been setting up for weeks now. Friday's price action to close out the month looks like an initiation move that has more room to run. While that is hard to call on the first few days, the move was a very significant one at an important zone on the charts.
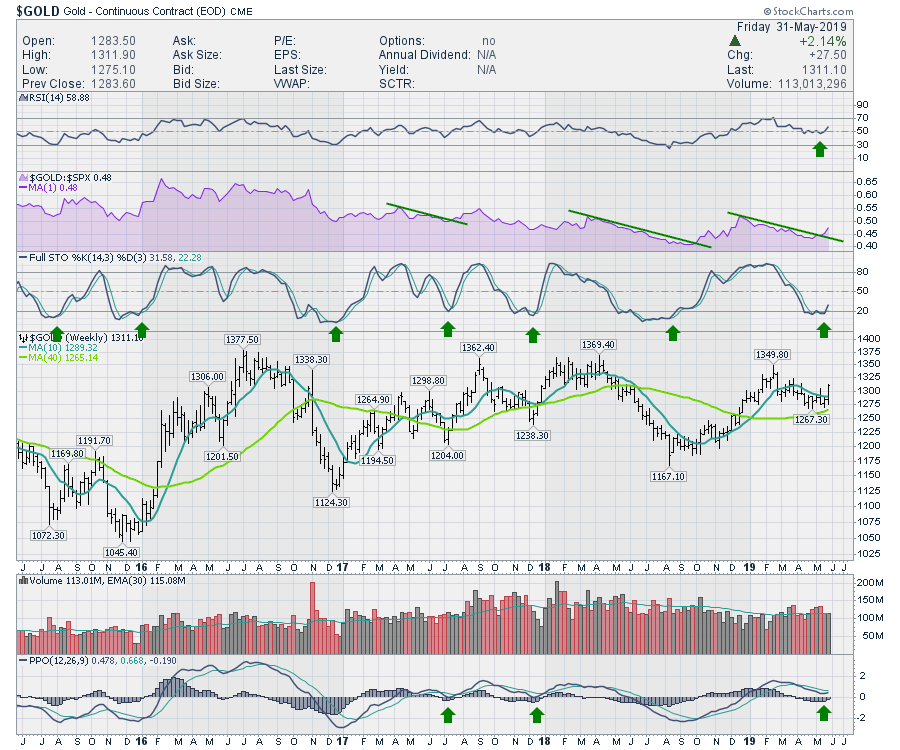
Focusing in on price, Gold has been able to hold above the 40-week moving average since the December move where price originally crossed up above it. Gold also finished at the top of the weekly price bar for the first time since February, its highest close since mid-March. There are not many asset classes in equities or commodities that finished the past week at the top of the price bar for the first time in months. Another bullish perspective is that the PPO turned up (without crossing the signal line) while above zero. In two past instances where it has crossed the signal line while above zero, the price rallied for at least a couple of months. Next week, we'll see if the price holds here as well as if the PPO finishes crossing above the signal line, as that has not happened yet. The bullish pattern is set up, but we'll need to see it play out.
The relative strength (shown in purple) is at a 3-month high for the first time since last year. Typically, that is a positive signal, as the relative strength is making higher highs ahead of price. One of the first signals on a weekly chart will be a move on the stochastics above 20, which also happened Friday.
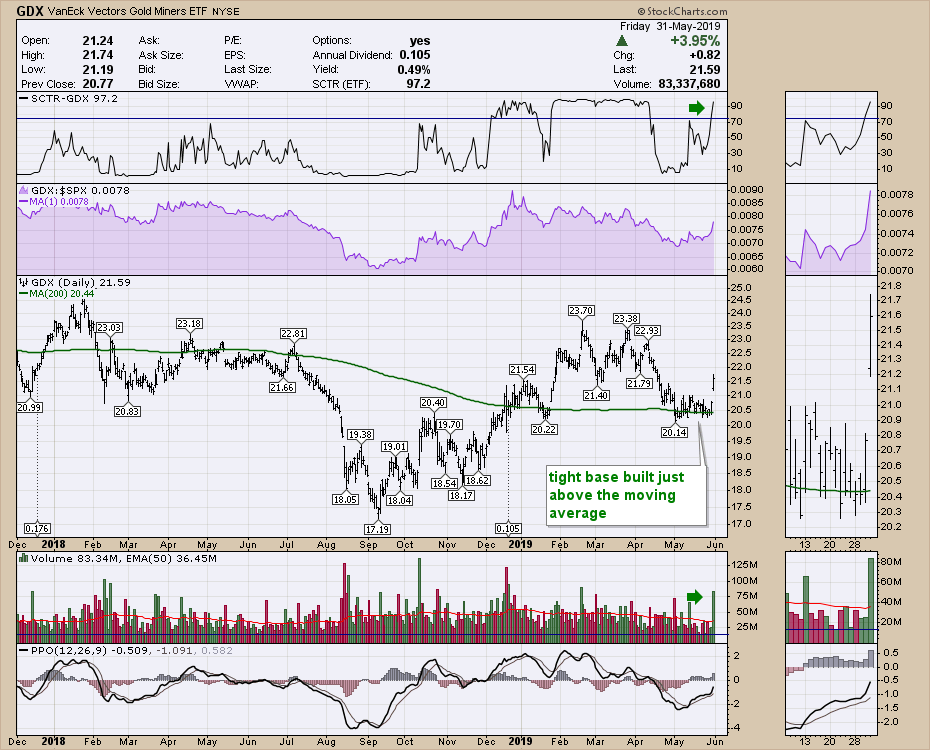
 One of the big clues regarding Gold is how well the miners outperformed the Gold price to finish the week. Gold was up 1.3% Friday, but the miners were up 3.9%, which was triple Gold's performance for the day. There are also a couple of other things on this chart that make it interesting. On the left side of the chart, the SCTR was never above 75. After surging up above 75 and going on a run, the gold miners gently pulled back and the SCTR dropped under 10. After a brief period down at 10, the SCTR has now surged back to become one of the top performing ETFs. This change in behavior compared to other stocks is important and is one of the gems that shows up in the SCTR indicator. While the relative strength did not make new three-month highs, it did pop up to new one-month highs. I'll be watching for that to keep outperforming next week. One of the reasons we have been watching Gold on Market Roundup is that the volume was getting extremely low. I have drawn a horizontal line at the May 21st volume level and May 20th was also low. Comparing that level by looking left, this was the lowest volume on the chart, including half-days around Thanksgiving and Christmas. When the volume goes eerily quiet, the behavior is changing.
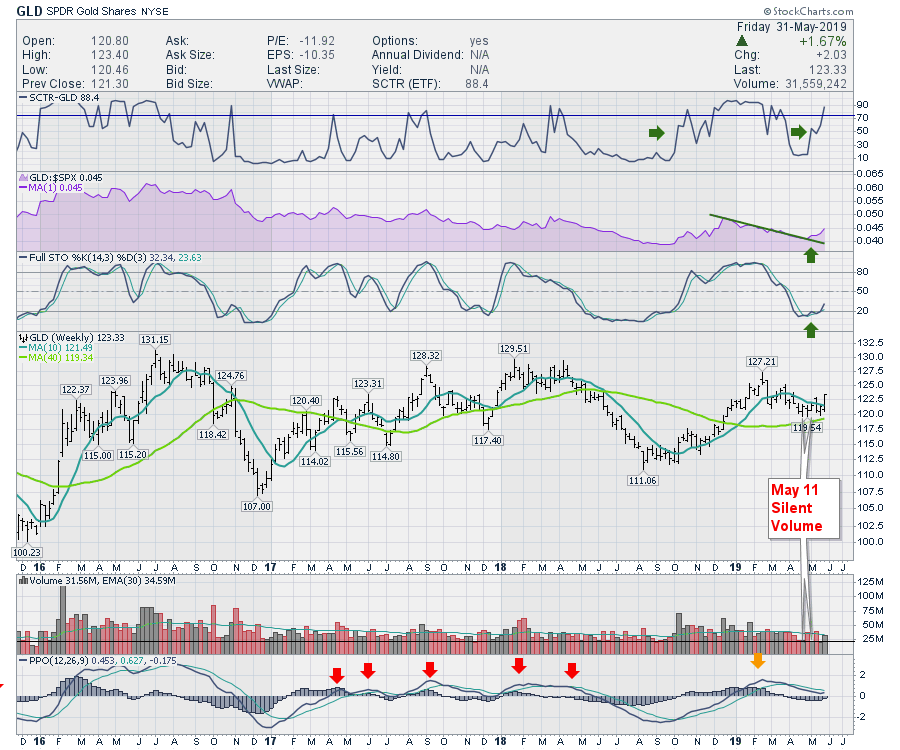
 From my Market Roundup charts, we can see what the volume profile looked like on GLD. Three of the last five weeks had the lowest volumes in three years! While we don't know how that will play out, it definitely suggests watching for a potential trend change.
 As Gold appears to be one of the bright spots this week, I'll have more information on the gold and silver setup in my Market Roundup on Saturday evening on the StockCharts YouTube channel. There are numerous other charts that I have been following to confirm the move in gold that ramped up as well. This bullish setup definitely looks promising for GDX and GLD. I would buy the miners more than the metal, as they tend to move farther and faster. I will work through the gold mining stocks on the video to point out which ones are set up nicely right now.
Good trading,
Greg Schnell, CMT, MFTA
Senior Technical Analyst, StockCharts.com
Author, Stock Charts For Dummies
Want to stay on top of the market's latest intermarket signals?
– Follow @SchnellInvestor on Twitter
– Connect with Greg on LinkedIn
– Subscribe to The Canadian Technician
