John Murphy joined us on MarketWatchers LIVE on Thursday (8/8/19) and showed us some very interesting charts on the Sector SPDRs. The deterioration of nearly all of them prompted me to look at them using the Price Momentum Oscillator (PMO) in CandleGlance.
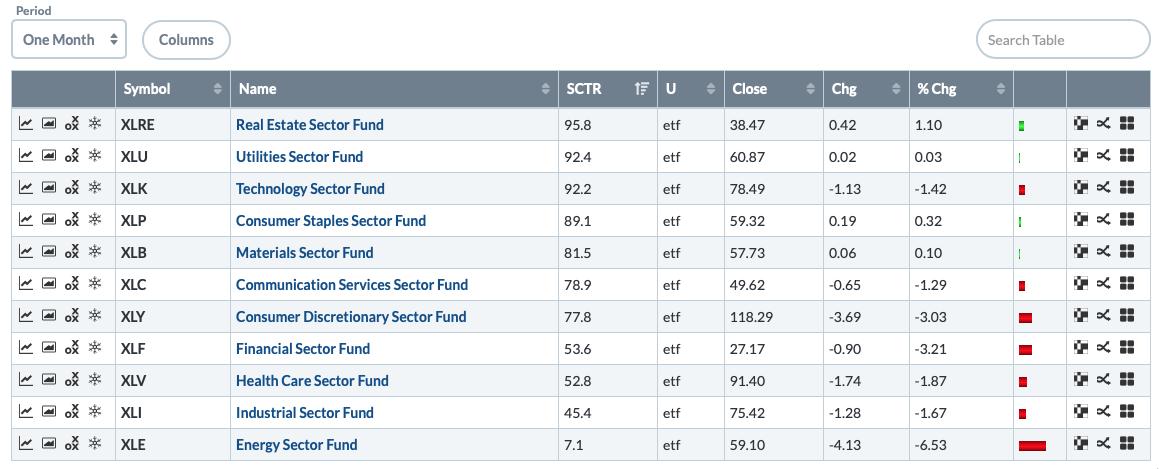
Let's start by looking at the Sector Summary over the past month. I've sorted the sectors by their StockCharts Technical Rank. Note that, of the top four sectors, three are defensive: Real Estate, Utilities and Consumer Staples. Healthcare, one of the other defensive groups, is still lagging.
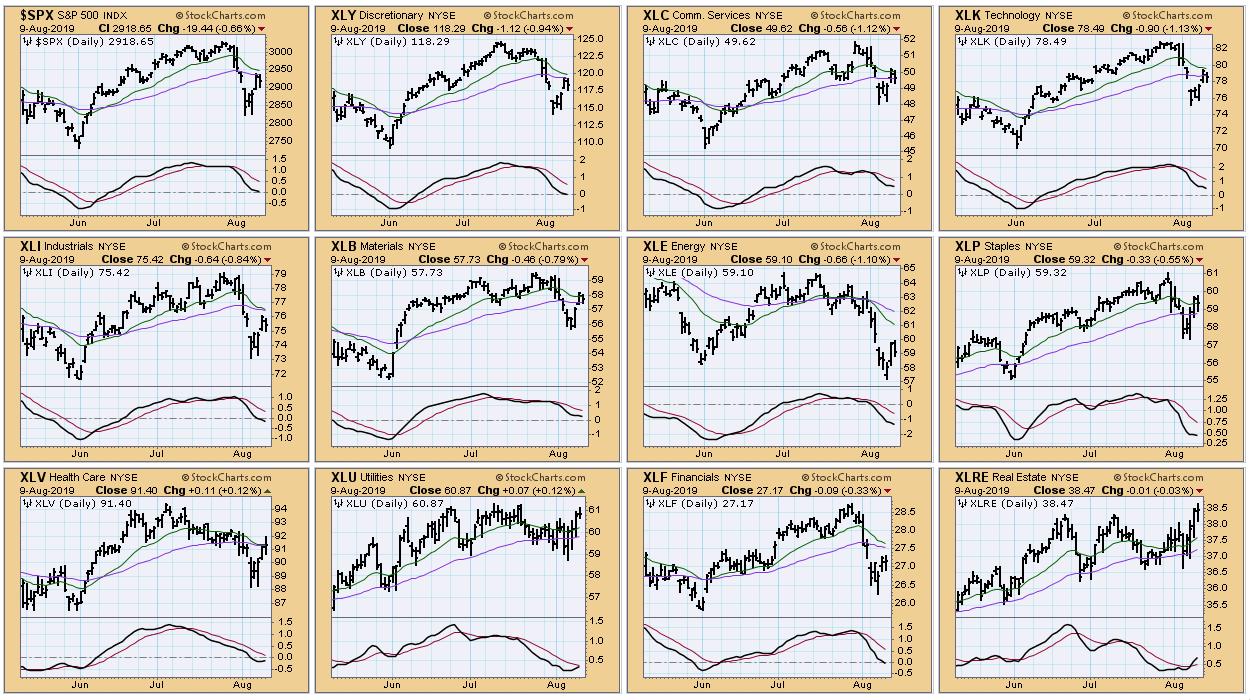
As far as the sector CandleGlance goes, note that the only three sectors with rising PMOs are Healthcare, Utilities and Real Estate. Let's look at the charts for those sectors.
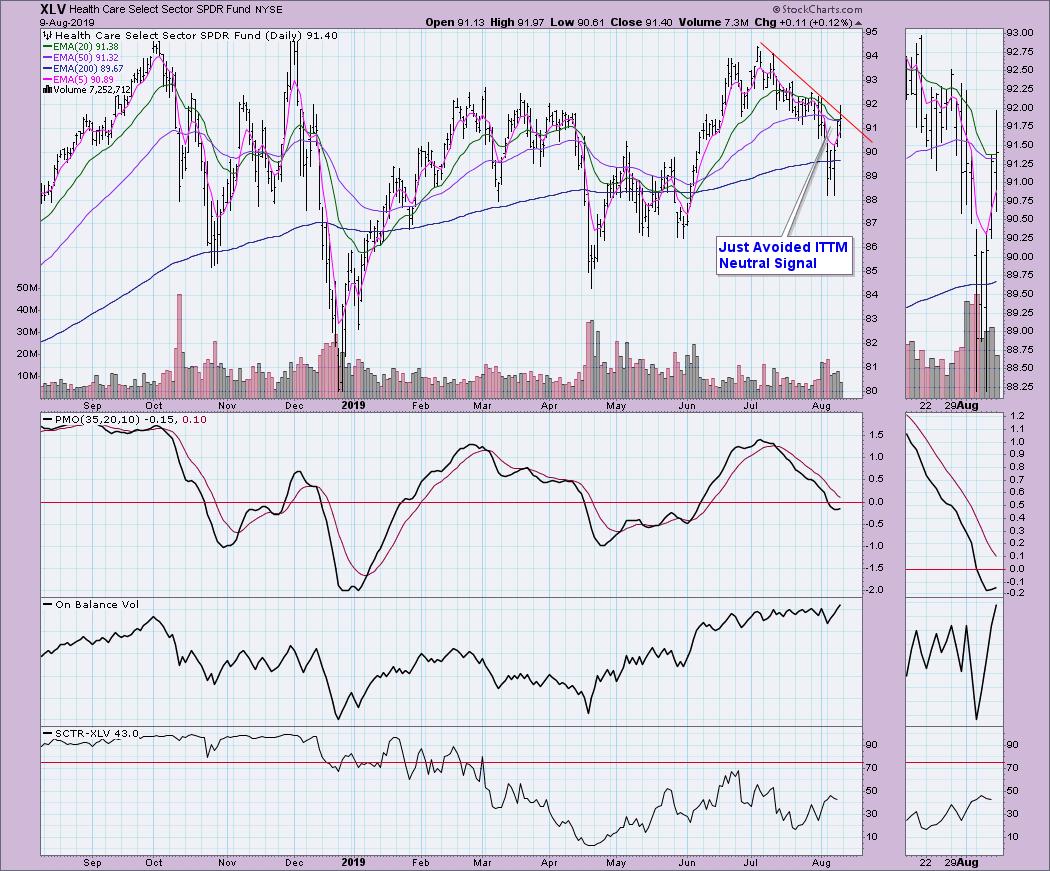
Healthcare has been in a declining trend, although today it popped just above the declining tops trend line. I thought we'd end up with a new IT Trend Model Neutral signal, as the 20-EMA was just about ready to cross below the 50-EMA. Today it managed to close just above the 20-EMA, narrowly avoiding the Neutral signal. Although the PMO is rising, this sector is showing weakness. The good news is that the OBV made a new high, which might be the lead-in to a breakout move.
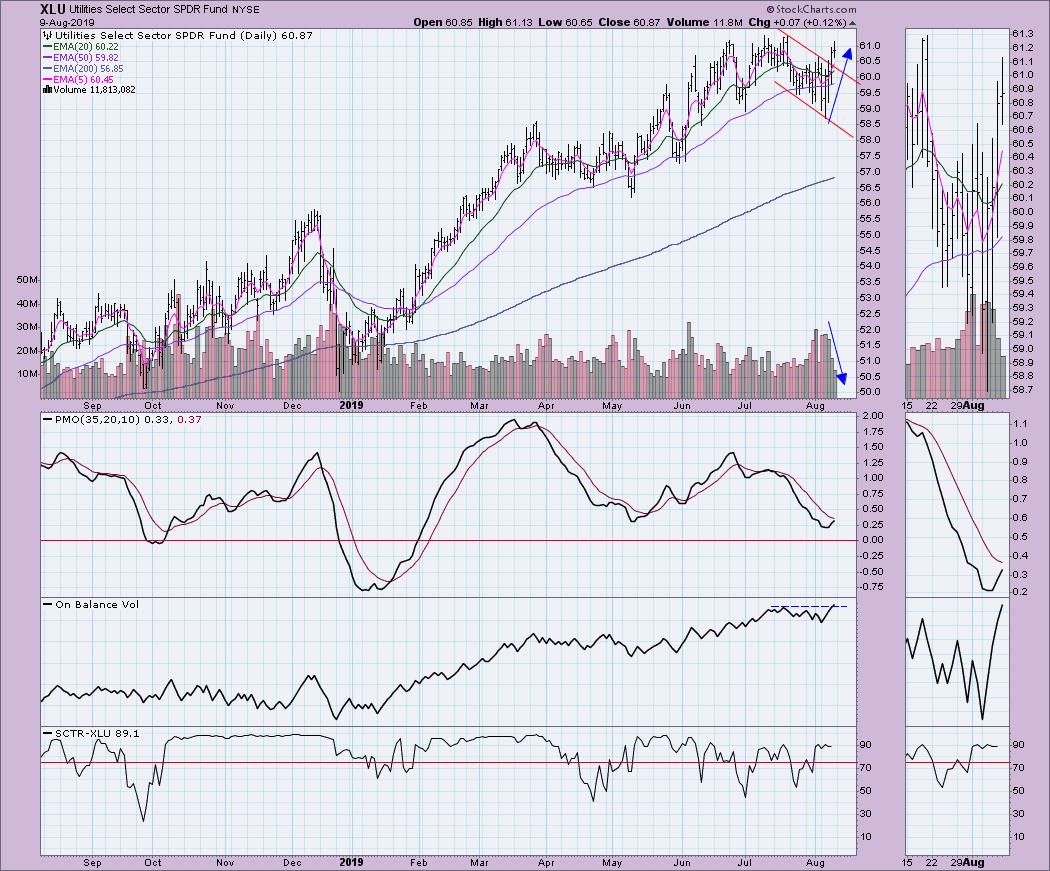
I am liking Utilities, given the nice breakout from the declining trend. However, there is a major negative divergence in the volume pattern. Note the declining volume on this rally, which typically means that it isn't sustainable. That said, the PMO looks healthy and even the OBV made a new high. Caution is warranted as XLU nears overhead resistance at its all-time high.
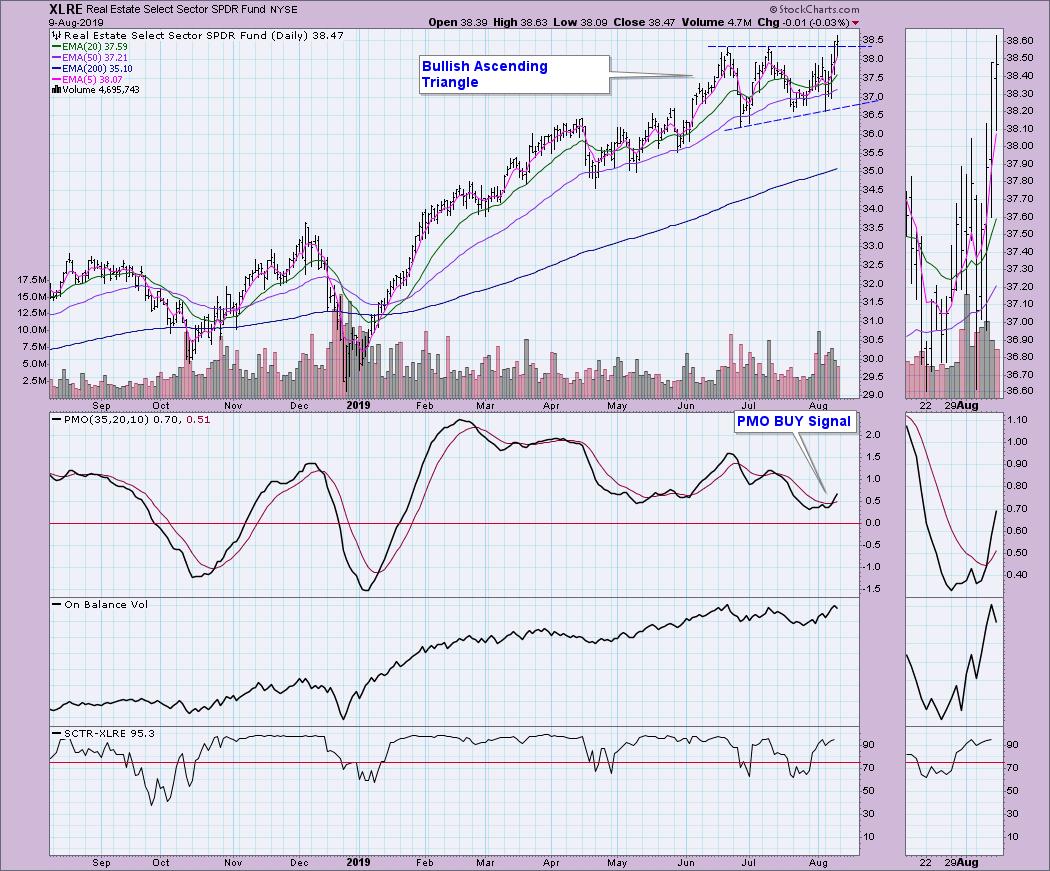
Real Estate, meanwhile, has not only logged a PMO BUY signal, but managed a breakout yesterday that held at the close today. There is a clear bullish ascending triangle that indicates price is in for a longer-term rally. OBV and SCTR look good, but I am finding the actual volume pattern concerning as volume diminished on the rally.
Conclusion: The defensive areas of the market are showing strength over the past month. This is usually a sign of a market top forming. I note that Gold and Bonds (both "safe haven") have taken off. All of this suggests the market, although rising over the past few days, is vulnerable to another decline. The short term is still somewhat positive, but if we keep seeing increased internal strength within the defensive areas of the market, the intermediate-term picture isn't so rosy for the broad market.
Watch the latest episode of DecisionPoint with Carl & Erin Swenlin LIVE on Fridays 4:30p EST or on the StockCharts TV YouTube channel here!
Technical Analysis is a windsock, not a crystal ball.
Happy Charting! - Erin
erinh@stockcharts.com
Helpful DecisionPoint Links:
DecisionPoint Shared ChartList and DecisionPoint Chart Gallery
Price Momentum Oscillator (PMO)
Swenlin Trading Oscillators (STO-B and STO-V)
**Don't miss DecisionPoint Commentary! Add your email below to be notified of new updates"**
