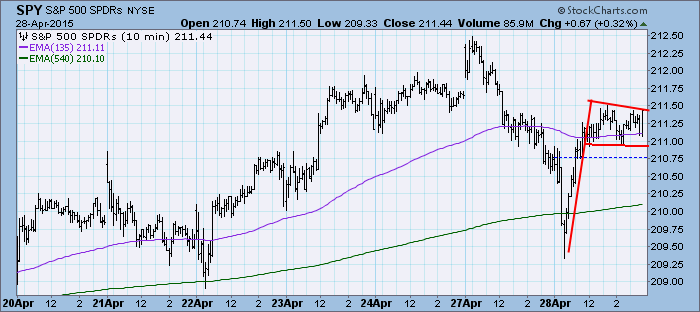
It was a volatile morning but price consolidated in the afternoon, resting as investors contemplate upcoming news from the Fed on Wednesday. Yesterday, price disintegrated. It appeared this morning as if the market planned on continuing into a strong correction; however, upon reaching support near Wednesday's low, it turned back around and spent the day forming a bullish flag formation. If it executes, the minimum upside target would be around 213.50.
The purpose of the DecisionPoint Daily Update is to quickly review the day's action, internal condition, and Trend Model status of the broad market (S&P 500), the nine SPDR Sectors, the U.S. Dollar, Gold, Crude Oil, and Bonds. To ensure that using this daily reference will be quick and painless, we are as brief as possible, and often we let a chart speak for itself.
SIGNALS: Here we include the current day's signal table, an excerpt from the DecisionPoint Alert Daily Report.
DECISIONPOINT ALERT DAILY REPORT
Tuesday, 4/28/2015

************************ DECISIONPOINT MARKET POSTURE ***********************

The following is the market posture suggested by our mechanical trend-
following tools. These are not trading recommendations, rather they are price
activity flags that should be qualified by chart analysis. The Trend Model is
used on all indexes.


                                     Days   Index     04/28   Points  Percent
Index               Posture     Date Elap  @Start     Close      P/L      P/L
------------------- ------- -------- ---- -------   -------  -------  -------
Stocks Medium-Term  Bullish 10/31/14  179   199.66   211.44   +11.78    +5.9%
Stocks Long-Term    Bullish 10/31/14  179   199.66   211.44   +11.78    +5.9%
Gold (NY Spot)      Bearish 02/23/15   64  1200.80  1213.90   -13.10    -1.1%
20+Yr T-Bond  (TLT) Bullish 03/19/15   40   130.55   127.29    -3.26    -2.5%
------------------- ------- -------- ---- -------   -------  -------  -------
Dollar Index  (UUP) Bullish 07/21/14  281    21.47    25.28    +3.81   +17.7%
Commodities   (GSG) Bullish 04/24/15    4    21.17    21.12    -0.05    -0.2%
Crude Oil     (USO) Bullish 04/21/15    7    19.45    19.60    +0.15    +0.8%
------------------- ------- -------- ---- -------   -------  -------  -------
S&P 500       (SPY)     BUY 10/31/14  179   199.66   211.44   +11.78    +5.9%
S&P Equal Wt  (RSP)     BUY 11/03/14  176    77.46    82.33    +4.87    +6.3%
Dow           (DIA)     BUY 02/03/15   84   175.43   180.84    +5.41    +3.1%
Nasdaq 100    (QQQ)     BUY 10/29/14  181    99.21   110.04   +10.83   +10.9%
NDX Equal Wt (QQEW)     BUY 10/30/14  180    40.47    44.96    +4.49   +11.1%
S&P 100       (OEF)     BUY 02/04/15   83    89.49    93.06    +3.57    +4.0%
S&P 400 MidCp (IJH)     BUY 11/05/14  174   140.67   152.42   +11.75    +8.4%
S&P 600 SmlCp (IJR)     BUY 11/03/14  176   110.56   118.82    +8.26    +7.5%
Total Market  (VTI)     BUY 11/03/14  176   103.05   109.57    +6.52    +6.3%
Consumer Disc (XLY)     BUY 11/05/14  174    67.05    76.68    +9.63   +14.4%
Cons Disc EWt (RCD)     BUY 11/03/14  176    82.41    91.35    +8.94   +10.8%
Consumer Stpl (XLP)     BUY 08/20/14  251    44.00    48.97    +4.97   +11.3%
Cons Stpl EWt (RHS)     BUY 10/21/14  189    97.26   108.05   +10.79   +11.1%
Energy        (XLE)     BUY 04/09/15   19    79.79    82.30    +2.51    +3.1%
Energy EWt    (RYE)     BUY 04/09/15   19    69.34    71.09    +1.75    +2.5%
Financial     (XLF)     BUY 02/13/15   74    24.34    24.33    -0.01    -0.0%
Financial EWt (RYF)     BUY 02/05/15   82    44.13    44.65    +0.52    +1.2%
Health Care   (XLV)     BUY 10/23/14  187    63.89    73.40    +9.51   +14.9%
Health Cr EWt (RYH)     BUY 05/09/14  354   115.73   156.67   +40.94   +35.4%
Industrial    (XLI)     BUY 04/14/15   14    56.50    56.40    -0.10    -0.2%
Industrl EWt  (RGI)     BUY 02/09/15   78    88.54    90.10    +1.56    +1.8%
Materials     (XLB)     BUY 04/15/15   13    50.19    50.77    +0.58    +1.2%
Materials EWt (RTM)     BUY 04/10/15   18    86.75    88.65    +1.90    +2.2%
Technology    (XLK)     BUY 02/09/15   78    40.87    43.39    +2.52    +6.2%
Technolgy EWt (RYT)     BUY 02/05/15   82    89.42    93.65    +4.23    +4.7%
Utilities     (XLU) Neutral 02/20/15   67    45.33    44.93     ....     ....
Utilities EWt (RYU) Neutral 02/25/15   62    75.94    75.50     ....     ....

Average                               124                               +7.4%
NOTE: Mechanical trading model signals define the implied bias of the price index based upon moving average relationships, but they do not necessarily call for a specific action. They are information flags that should prompt chart review. Further, they do not call for continuous buying or selling during the life of the signal. For example, a BUY signal will probably return the best results if action is taken soon after the signal is generated. Additional opportunities for buying may be found as price zigzags higher, but the trader must look for optimum entry points. Conversely, exit points to preserve gains (or minimize losses) may be evident before the model mechanically closes the signal.
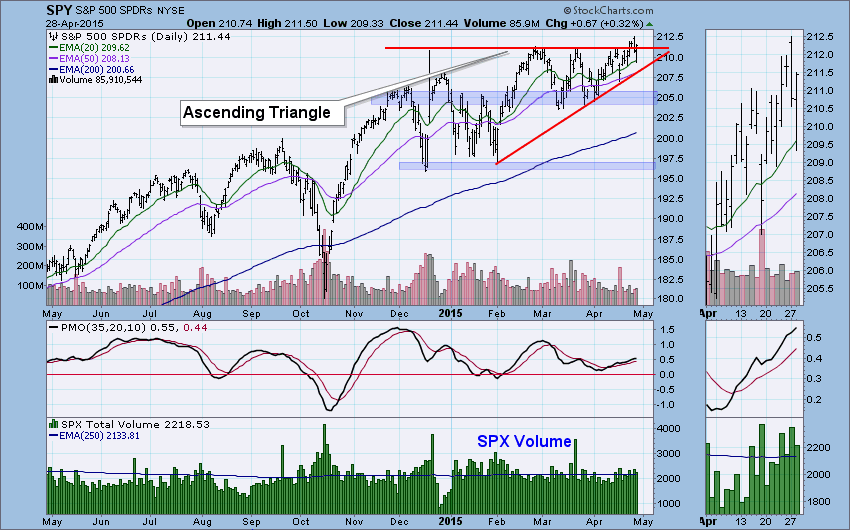
STOCKS: Based upon a 10/31/2014 Trend Model BUY signal, our current intermediate-term market posture for the S&P 500 (SPY) is bullish. The Trend Model, which informs our long-term outlook, is on a BUY signal as of 10/31/2014 so our long-term posture is bullish.
Yesterday there was good follow-through on the tiny breakout from the bullish ascending triangle last week. Today, it dipped back into the triangle. On the bright side it closed above support and could be hinting at more follow-through. The PMO is still rising which is bullish.
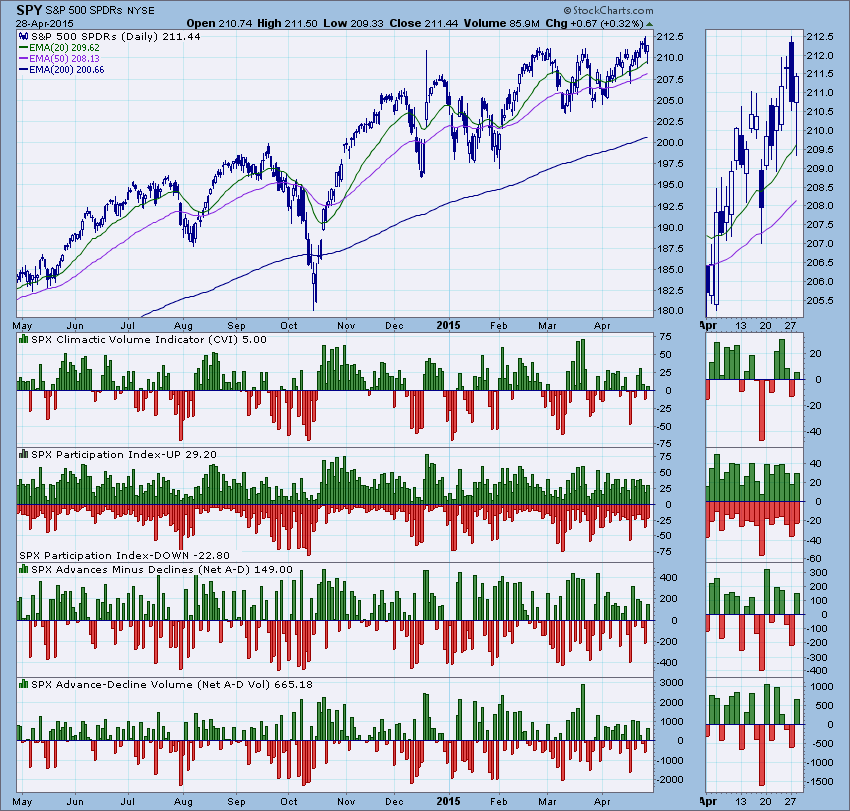
Ultra-Short-Term Indicators: I hate to say it yet again, but indicators are not helping us much. We use ultra-short-term indicators by looking for climactic activity. At this point there is none and so these indicators can be logged as neutral right now.
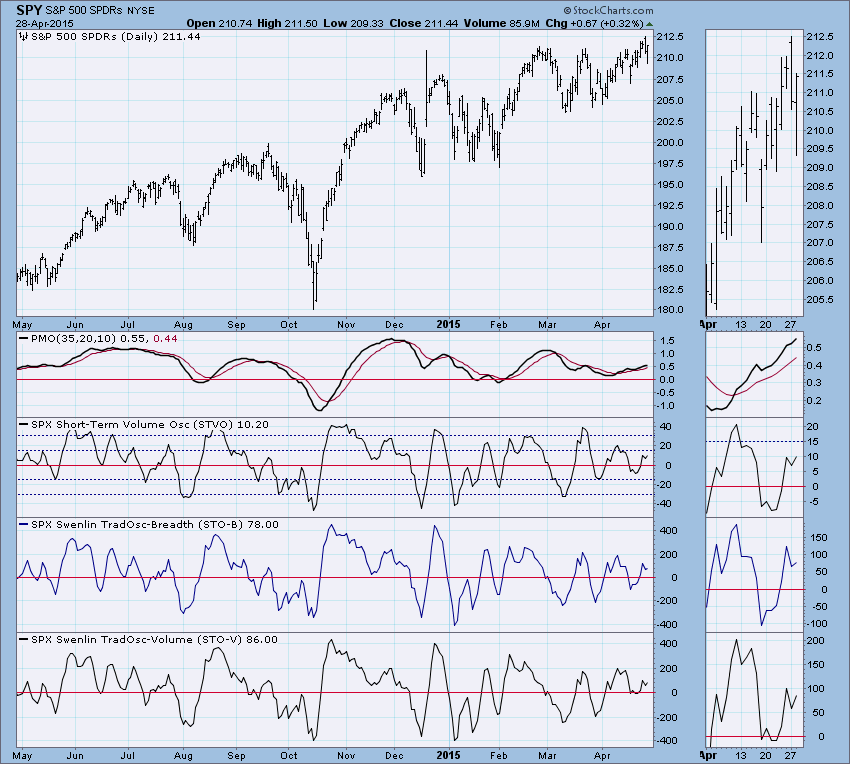
Short-Term Indicators: They topped in mostly neutral territory before exceeding the previous tops which is bearish, however, they turned up this week which is bullish. Only slightly though, the bottom and subsequent movement needs to overtake some of the previous highs with some follow-through.
Intermediate-Term Indicators: Sadly we aren't getting much more information out of our intermediate-term indicators either. The VTO looks bearish as it has been falling steadily. The ITBM and ITVM are beginning to oscillate around the zero line but overall they are in a rising trend which is somewhat bullish. They are twitching quite a bit which is why we can't take them as solidly bullish.
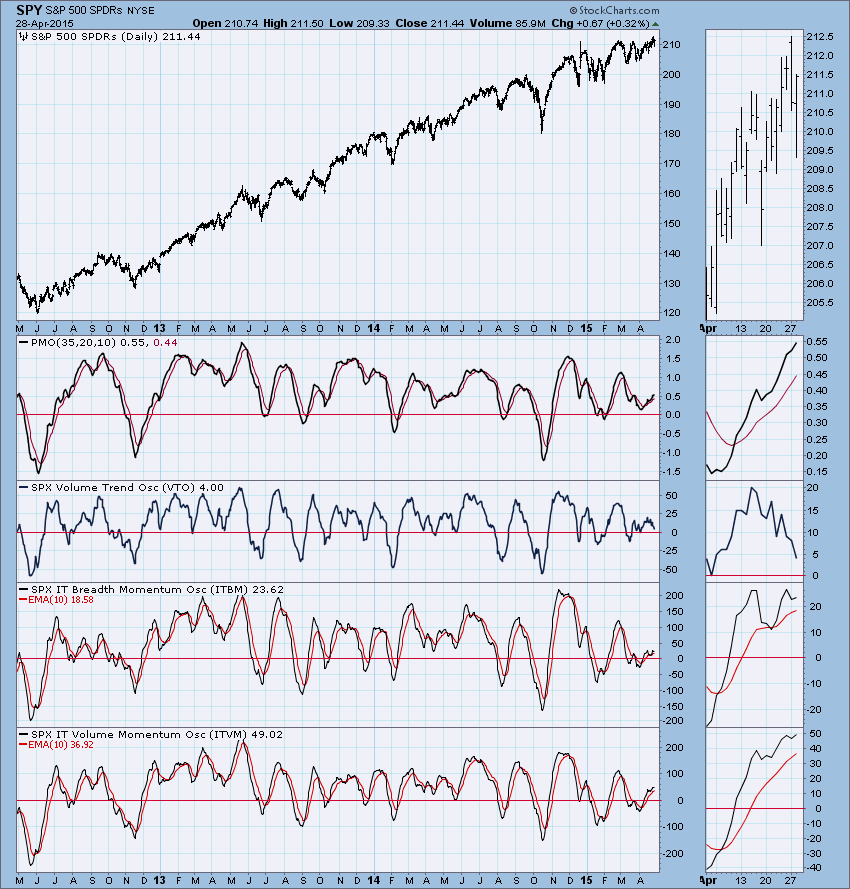
Conclusion: Overall our indicators are fairly unhelpful right now. The PMO is rising which is bullish and short-term indicators along with the ITBM and ITVM are somewhat bullish. The ascending triangle price pattern is what we are hanging our hat on right now. It is a bullish pattern and it is trying very hard to execute. In the ultra-short-term, the 10-minute bar chart has a bull flag which could portend of a more significant breakout from the triangle. Let's not forget, tomorrow the Fed releases its minutes which could cause some volatile market action.
Members, don't miss out on the "DP Weekly Report" on Fridays! The report is organized just like this one only Erin will take time to review the weekly charts in addition to daily charts. Click here to reach the DP Reports Blog and subscribe to email notifications so you'll receive an email as soon as it is published!
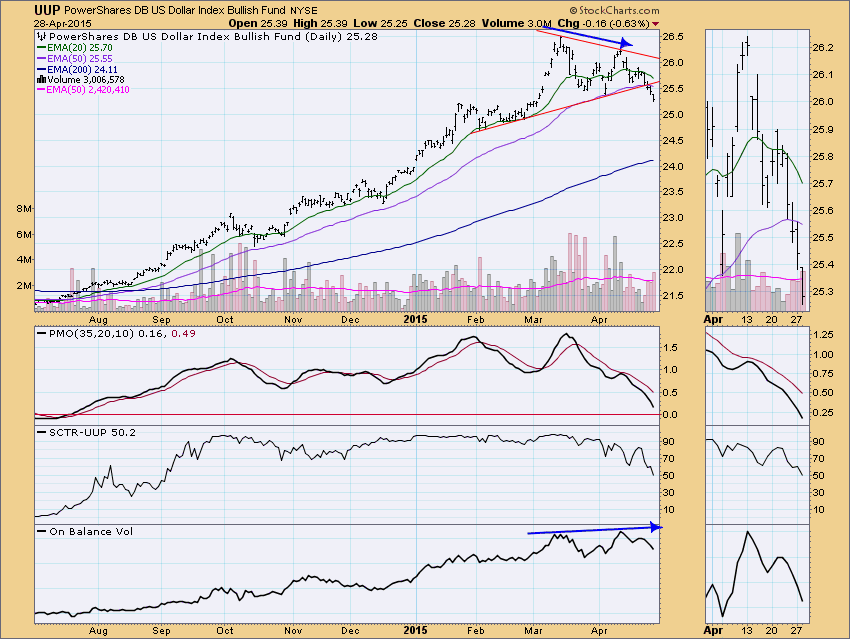
DOLLAR: As of 7/21/2014 the US Dollar Index ETF (UUP) is on a Trend Model BUY signal. The LT Trend Model, which informs our long-term outlook, is on a BUY signal as of 8/21/2014, so our long-term posture is bullish.
The dollar has broken from the symmetrical triangle formation which in this case, appears to be a reversal pattern. The PMO hasn't really strayed from its decline since the PMO SELL signal was generated in the middle of last month.
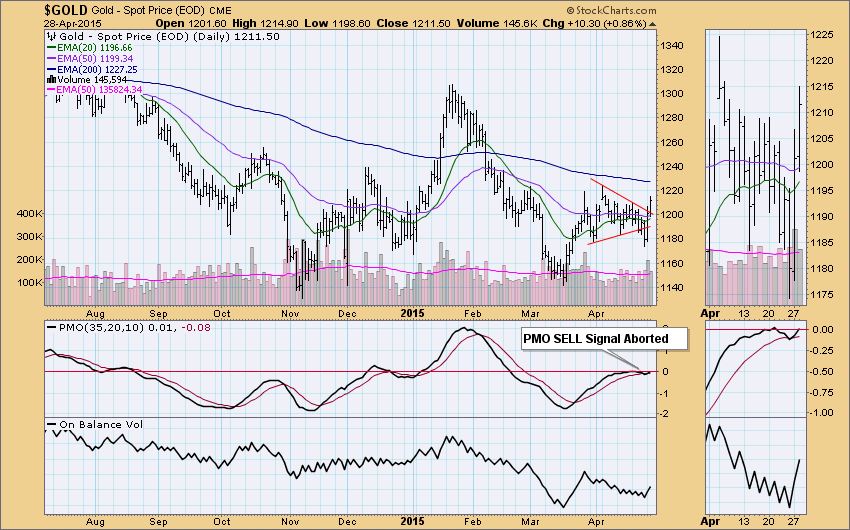
GOLD: As of 2/23/2015 Gold is on a Trend Model SELL signal. The LT Trend Model, which informs our long-term outlook, is on a SELL signal as of 2/15/2013, so our long-term posture is bearish.
With the weakness showing in the dollar, it isn't a surprise to see Gold coming back. Today it broke out above the symmetrical triangle formation which suggests that price will resume its rally that began at the low in March. The PMO had generated a SELL signal last week, but today it aborted and it is back on a BUY signal.
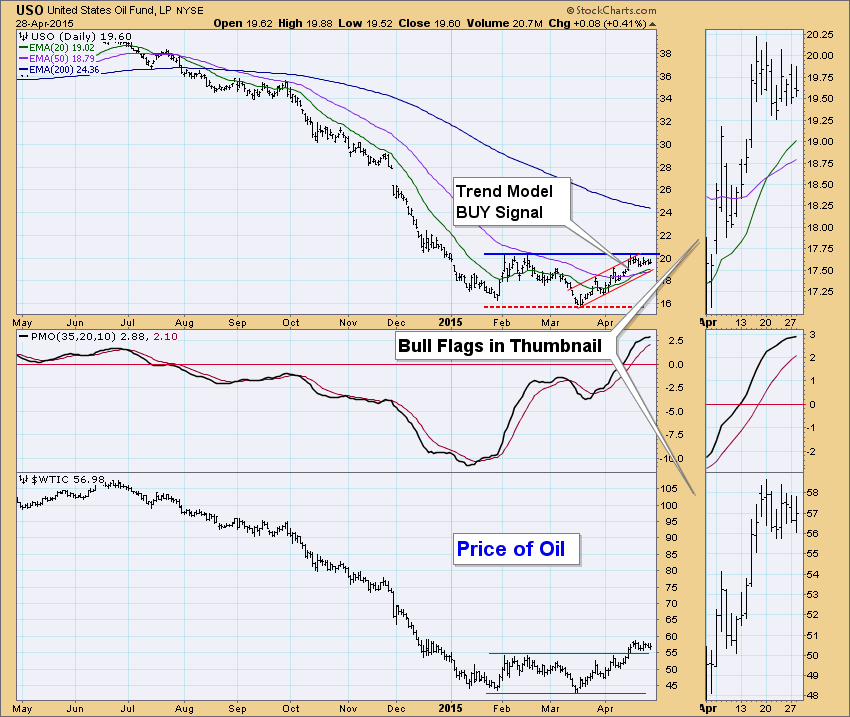
CRUDE OIL (USO): As of 4/21/2015 United States Oil Fund (USO) is on a Trend Model BUY signal. The LT Trend Model, which informs our long-term outlook, is on a SELL signal as of 8/28/2014, so our long-term posture is bearish.
Oil is teasing us, it looks bullish as far as the PMO, the price of oil and the rising trend channel it is in. The problem is that we haven't seen a breakout on USO yet and price action suggests that overhead resistance is very strong. There is a clear bull flag visible in the thumbnail, so that breakout will hopefully occur soon. The weak dollar will likely help.
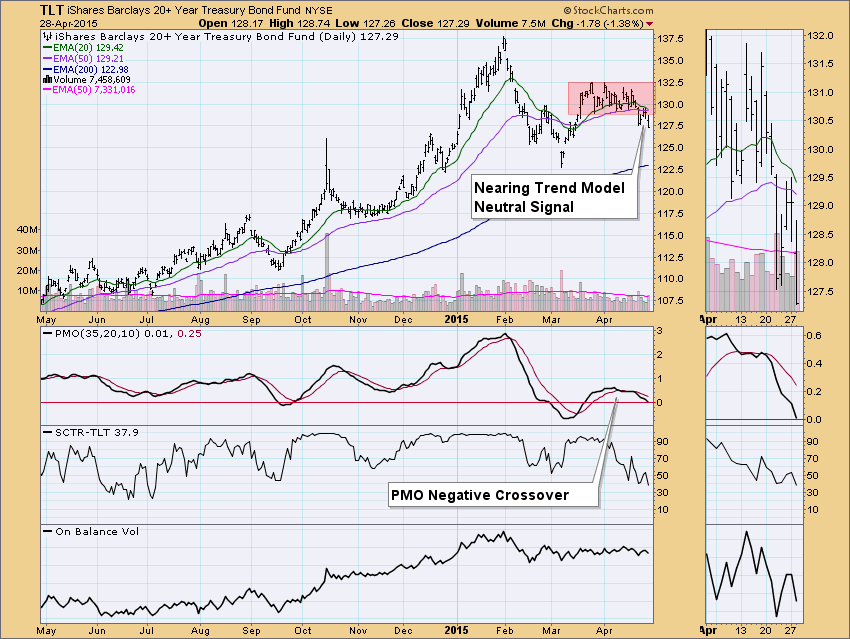
BONDS (TLT): As of 3/19/2015 The 20+ Year T-Bonds ETF (TLT) is on a Trend Model BUY signal. The LT Trend Model, which informs our long-term outlook, is on a BUY signal as of 3/24/2014, so our long-term posture is bullish.
Bonds have been oscillating within a consolidation channel but it looks now as if it will continue its breakdown. The Trend Model is very near generating a Neutral signal since the 20-EMA is about ready to cross below the 50-EMA. It is a neutral signal because the 50-EMA is above the 200-EMA which implies Bonds are still in a 'bull market', so the model goes to a Neutral rather than a SELL signal.
Technical Analysis is a windsock, not a crystal ball.
Happy Charting!
- Erin
