During our last webinar we received questions and comments to which we were unable to respond due to time constraints, so we will take this opportunity to address some of them.
Q: On $GOLD you see a double bottom. I see a potential head and shoulders top, implying further declines.
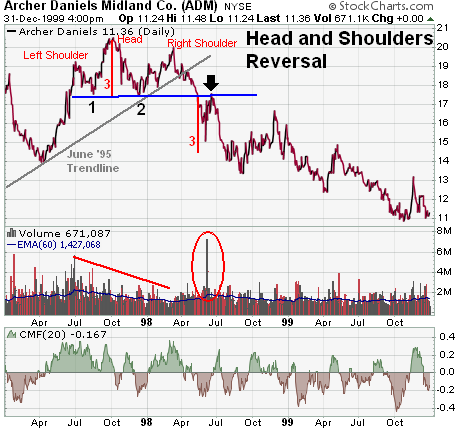
A: In the ChartSchool article on head and shoulders patterns there is the following emphasis: It is important to remember that [the head and shoulders] occurs after an uptrend and usually marks a major trend reversal when complete. Here is the example chart given. Note the advance that precedes the formation of the left shoulder.
On the current chart of $GOLD below the two red arrows mark the double bottom. We can see an 'impression' of a head and shoulders associated with those arrows, but IMHO the formation just doesn't measure up to the rules. First, the formation is not preceded by an advance--a head and shoulders top can't form on a bottom. Second, the neckline must be drawn across the low points between the shoulders and the head, and we can't see where a neckline would be drawn on this formation.
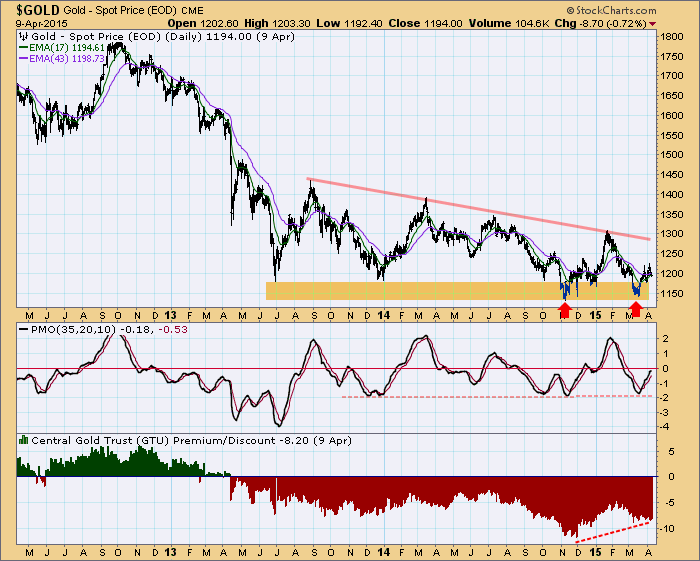
We still believe that there is a credible double bottom in place. The PMO has bottomed, and there is a positive divergence expressed by the smaller GTU discount at the most recent bottom compared to the November bottom. This is not a bullet proof situation by any means, but there is solid evidence that an upside reversal could be in the making.
Q: Are there any indications you see that the upcoming earnings season may by good or poor?
Q: I noticed that the earnings being used were GAAP earnings, as reported. Is there any way to get operating earnings (for the $SPX) instead?
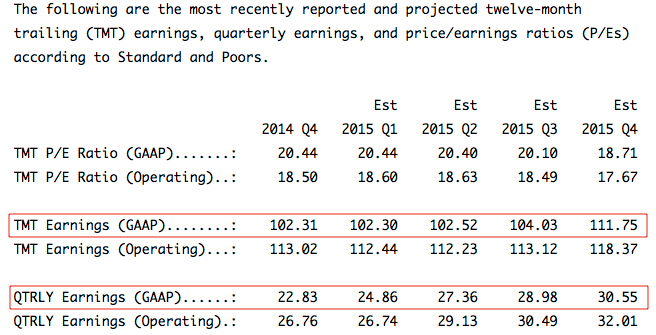
A: The table below has been extracted from the DP Overview of Market Fundamentals report, which is published daily. While we report operating earnings, we do not keep a data set so that it can be charted. As for indications regarding future earnings, we have highlighted the appropriate lines. Note that the last four columns are estimates of future earnings--twelve-month trailing (TMT) and quarterly. It appears that there will not be any significant improvement until 2015 Q4.
Q: When was the last time you had a SELL signal on the S&P 500?
A: A Trend Model SELL Signal is generated when the 50EMA is below the 200EMA (a long-term bear market) and the 20EMA crosses down through the 50EMA. The last Trend Model SELL Signal for SPY was November 28, 2011, but a BUY Signal was generated immediately after on November 30, 2011, clearly demonstrating that the Model is not infallible. A number of NEUTRAL Signals have been generated since then. This is when the a 20/50EMA crossover occurs when the 50EMA is above the 200EMA (a long-term bull market).
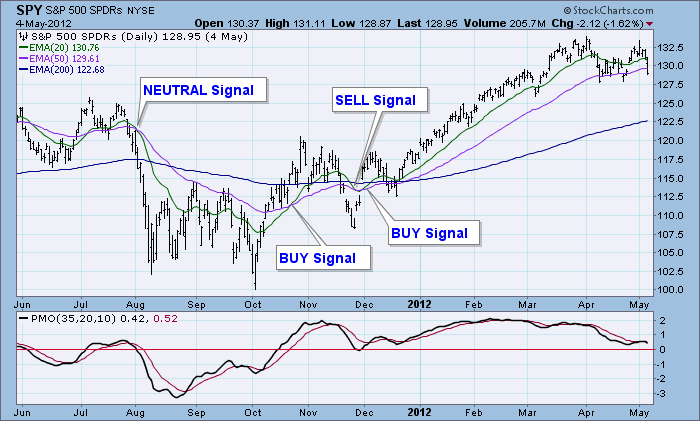
In the first half of the one-year period shown there were six (6) 20/50EMA crossovers, which is to be expected when the market is moving sideways, in this case in a 25% range. Brutal.
Q: It is difficult to understand PMO indicator, because when stocks move upward and the PMO can move sideways.
A: Think of the PMO as a speedometer. (See the chart above.) When price accelerates upward, the PMO moves up. When 'cruising speed' is reached (price is moving up at a consistent rate), the PMO begins to move sideways. When this happens well above the zero line, it tells us that conditions are very positive. The same rules would apply in reverse during price declines.
Be sure to attend our next DecisionPoint LIVE! webinar on Wednesday, April 15 at 4:30pm EDT (Sorry, no tax advice.) Click here to register.
Happy charting,
Carl
