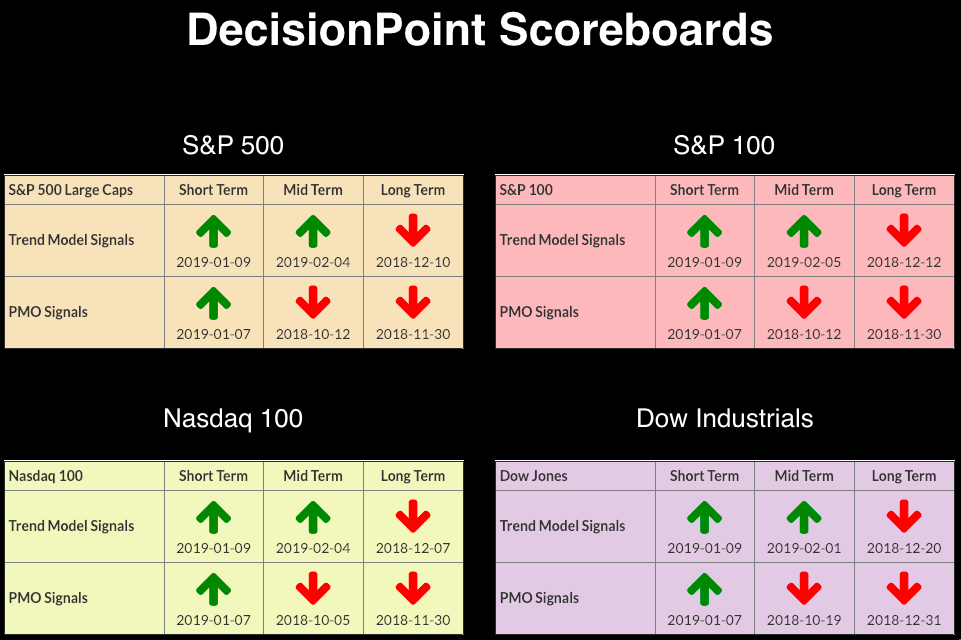
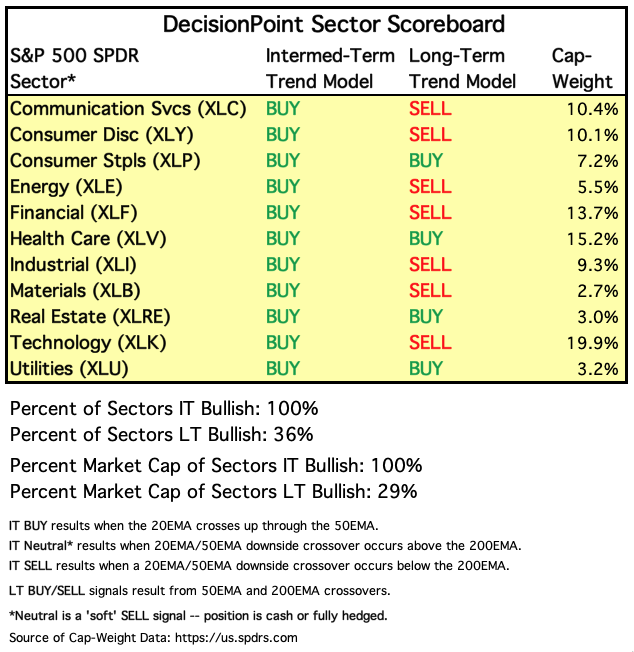
 No changes to the DecisionPoint Scoreboards today. My concern now rests on the new bearish rising wedge that has appeared on the SPX chart. Not all of the indicators are confirming the recent rally. The newest change to the DecisionPoint Sector Scoreboard was an IT Trend Model BUY on the Energy SPDR (XLE). This now has all of the sectors on IT BUY signals. LT BUY signals are only among the defensive sectors of Consumer Staples (XLP), Health Care (XLV), Real Estate (XLRE) and Utilities (XLU).
The DecisionPoint Alert presents a mid-week assessment of the trend and condition of the stock market (S&P 500), the U.S. Dollar, Gold, Crude Oil and Bonds.
Watch the latest episode of DecisionPoint on StockCharts TV's YouTube channel here!
SECTORS
Each S&P 500 Index component stock is assigned to one (and only one) of eleven major sectors. This is a snapshot of the Intermediate-Term and Long-Term Trend Model signal status for those sectors.
STOCKS
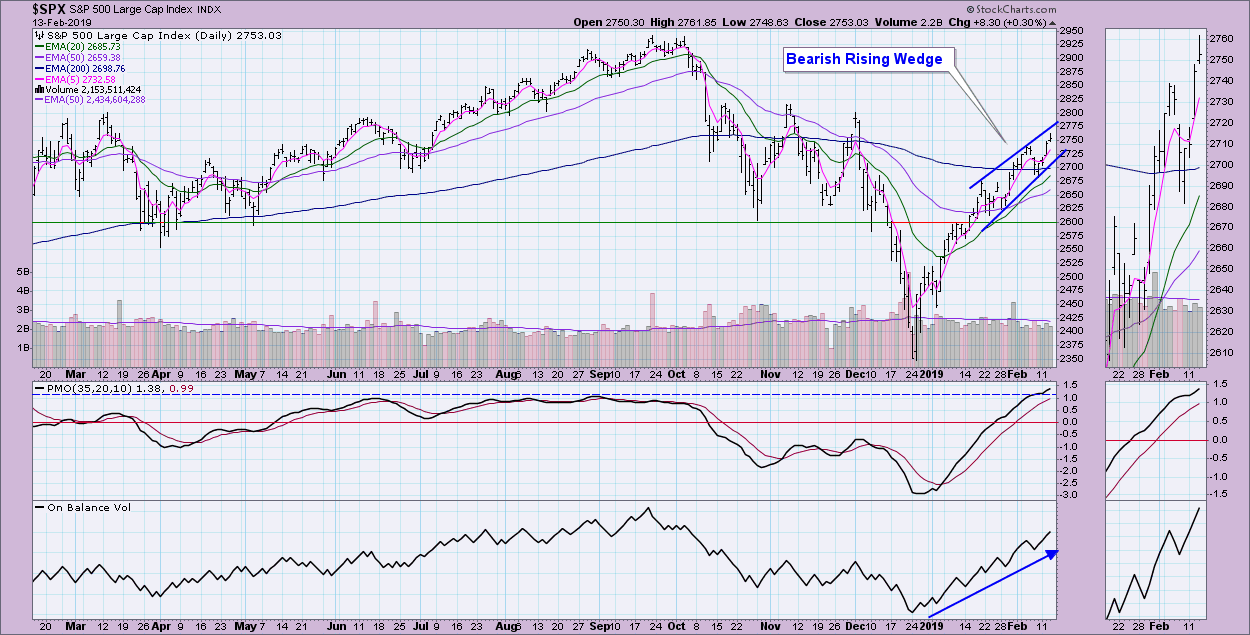
IT Trend Model: BUY as of 2/1/2019
LT Trend Model: SELL as of 12/14/2018
SPY Daily Chart: As noted, a bearish rising wedge has now formed. The PMO is very overbought, especially in a bear market configuration (50-EMA < 200-EMA). However, volume is still supporting the rally.
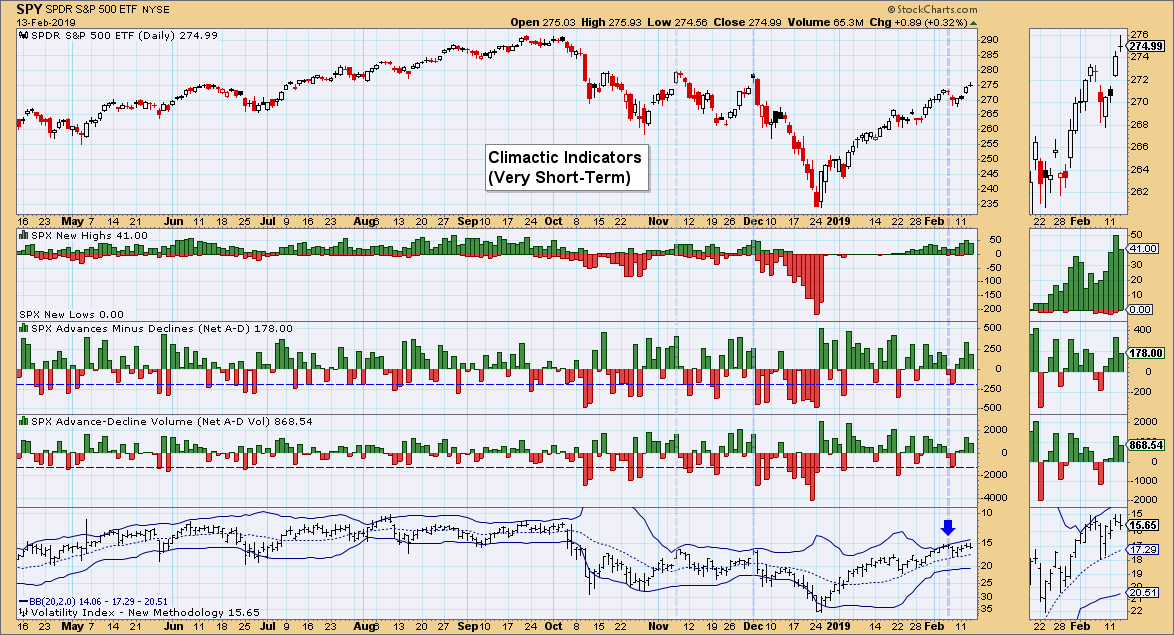
Climactic Market Indicators: I note that while the VIX isn't puncturing the upper Bollinger Band anymore, breadth is starting to edge a bit lower, which could suggest an exhaustion.
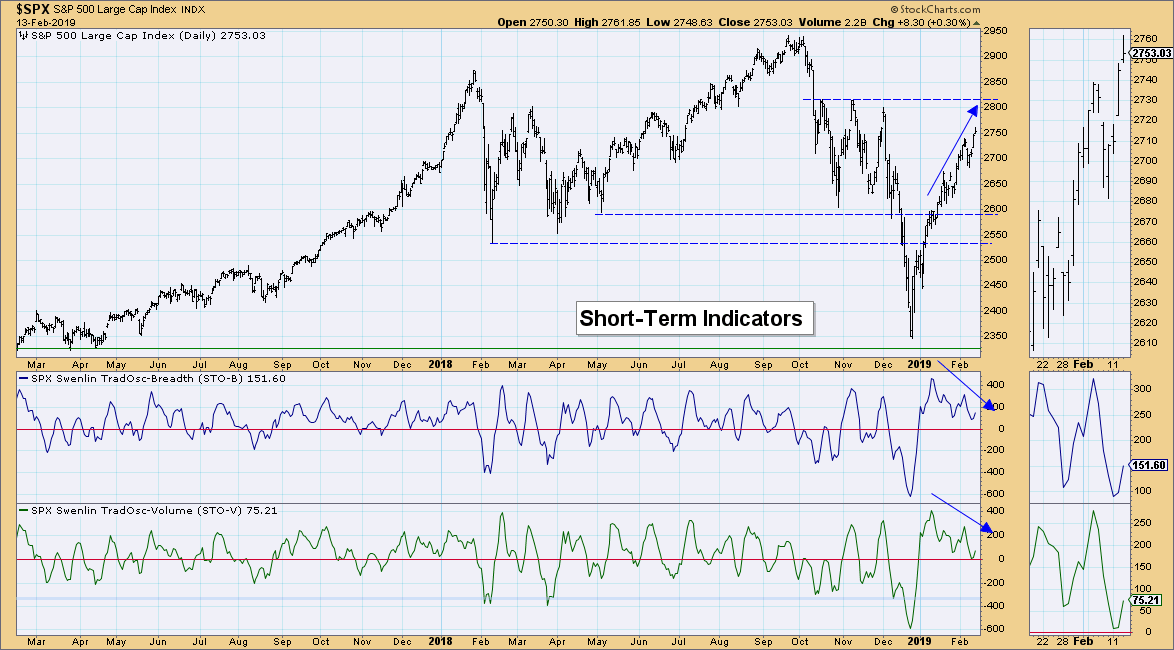
Short-Term Market Indicators: The negative divergence still has me concerned.
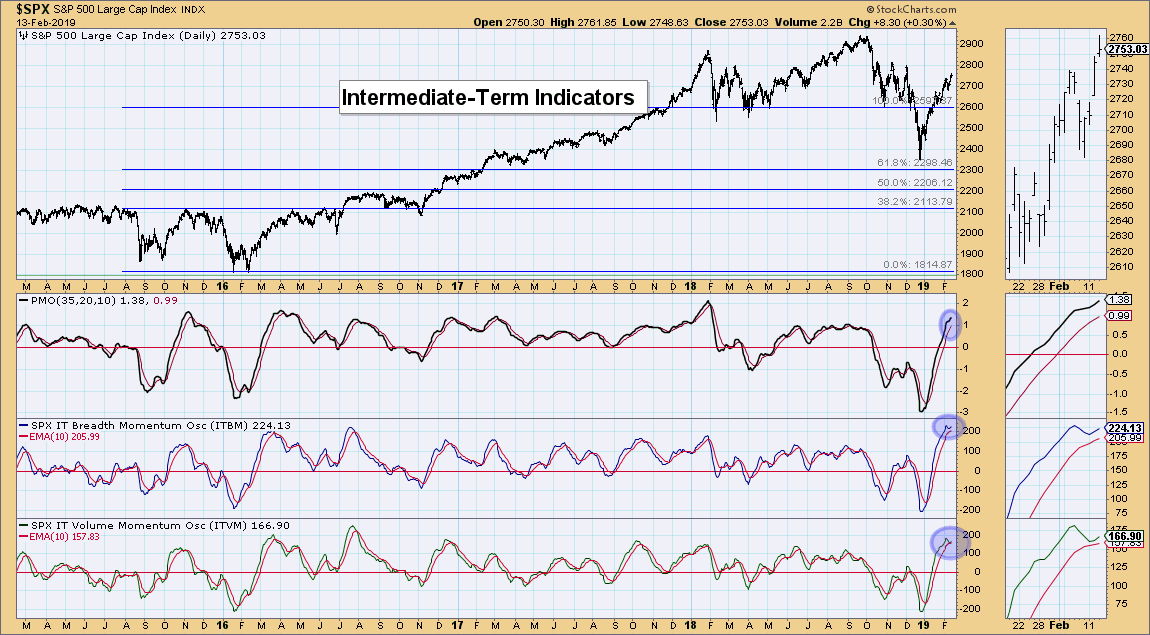
Intermediate-Term Market Indicators: I thought these indicators would have a negative crossover this week, but there were three days of higher prices and now they have turned back up. They are highly overbought, which suggests lower prices.
Conclusion: A new bearish rising wedge, combined with overbought indicators, suggests that we should see a pullback very soon.
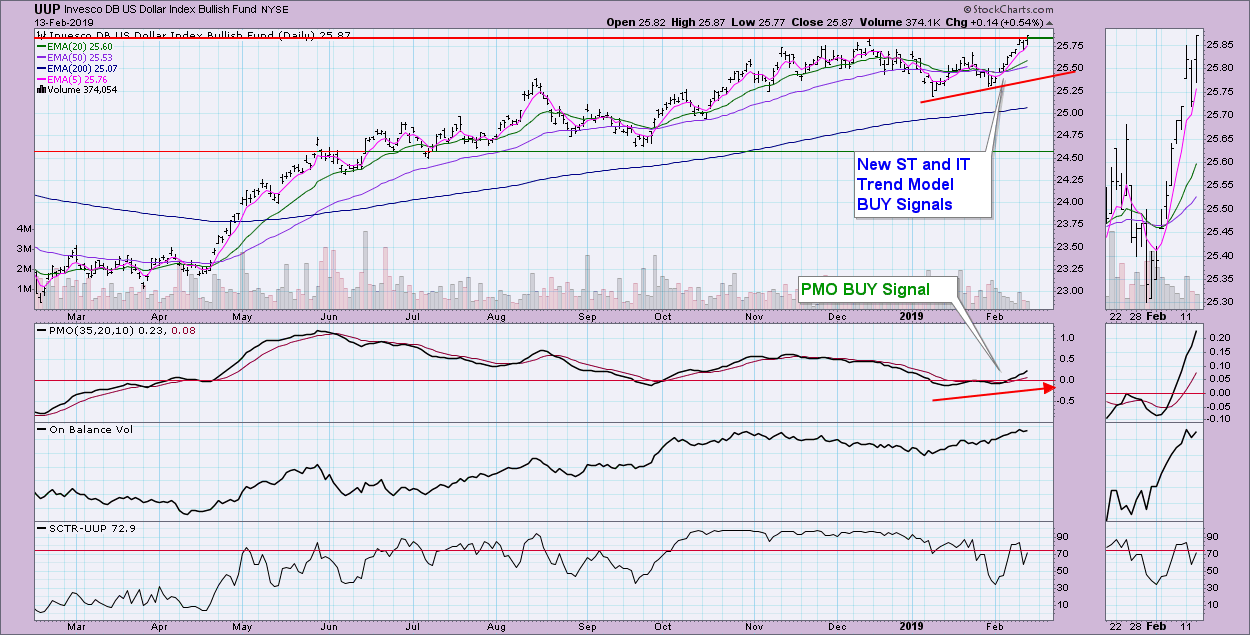
DOLLAR (UUP)
IT Trend Model: BUY as of 2/7/2019
LT Trend Model: BUY as of 5/25/2018
UUP Daily Chart: The Dollar is beginning to break out. We have a bullish confirmation with the PMO and fairly new ST and IT Trend Model BUY signals. I would expect UUP to continue to make new highs for the year.
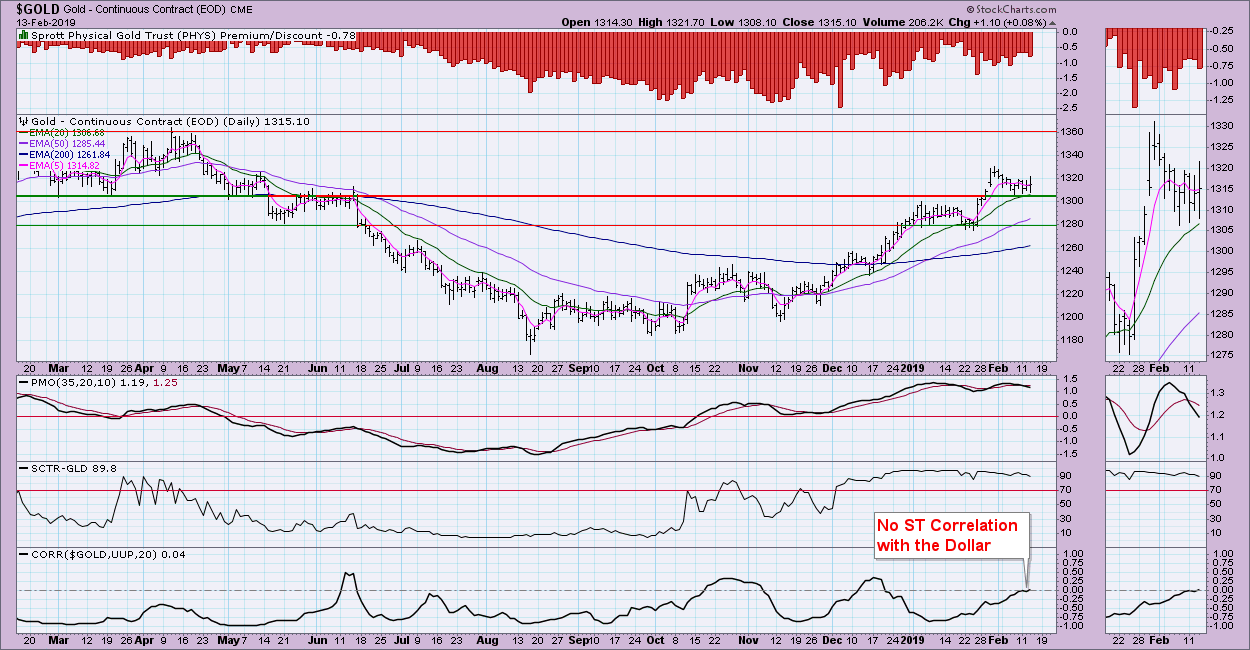
GOLD
IT Trend Model: BUY as of 10/19/2018
LT Trend Model: BUY as of 1/8/2019
GOLD Daily Chart: With the Dollar looking very bullish, one might expect that Gold would look especially bearish. Not so. The PMO certainly doesn't look good, but support is holding despite the rising dollar. The short-term correlation between the Dollar and Gold is zero, meaning Gold isn't as tied to the Dollar as it usually is and they are currently traveling independently from each other. If support fails at the 20-EMA or 1300 level, then I would pull back any positions you have (that's what I'll be doing). If the market turns south, Gold should hold up.
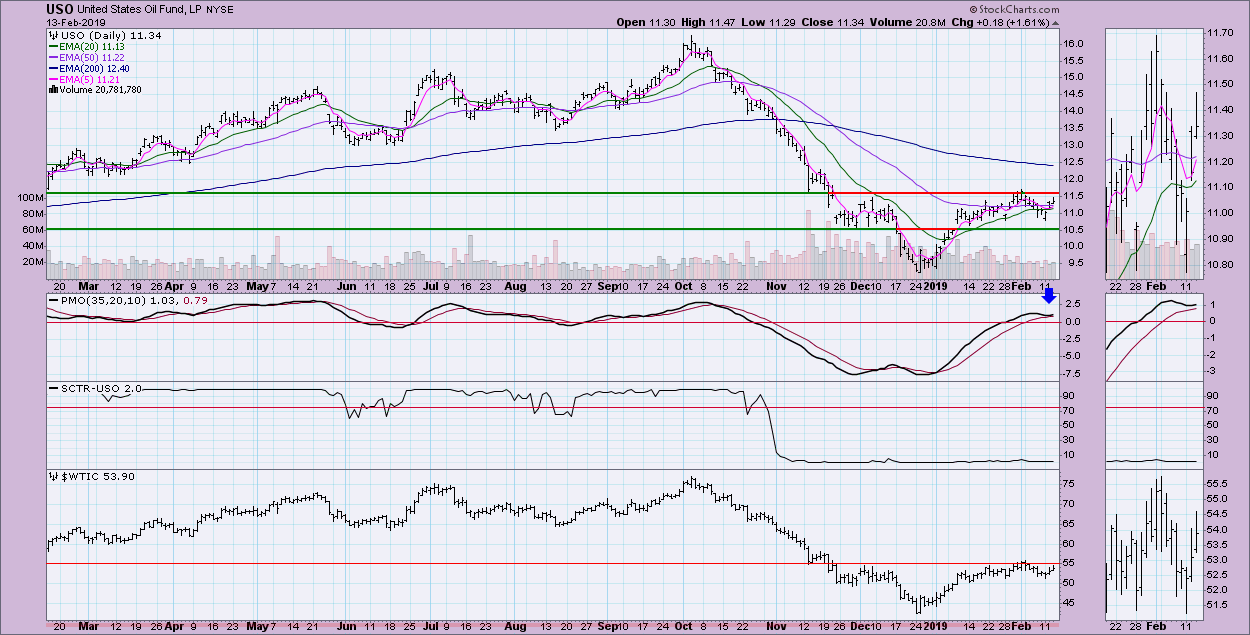
CRUDE OIL (USO)
IT Trend Model: Neutral as of 10/29/2018
LT Trend Model: SELL as of 11/23/2018
USO Daily Chart: The PMO is beginning to turn back up above both the signal line and zero line. As it's not particularly overbought, this does suggest a breakout. However, $WTIC has not been able to break out, not helped by the rising Dollar. That said, the conditions are right for a breakout, though I'd like to have the 50-EMA a bit closer to the 200-EMA. We have to temper our bullish expectations with the 50-EMA so far below the 200-EMA.
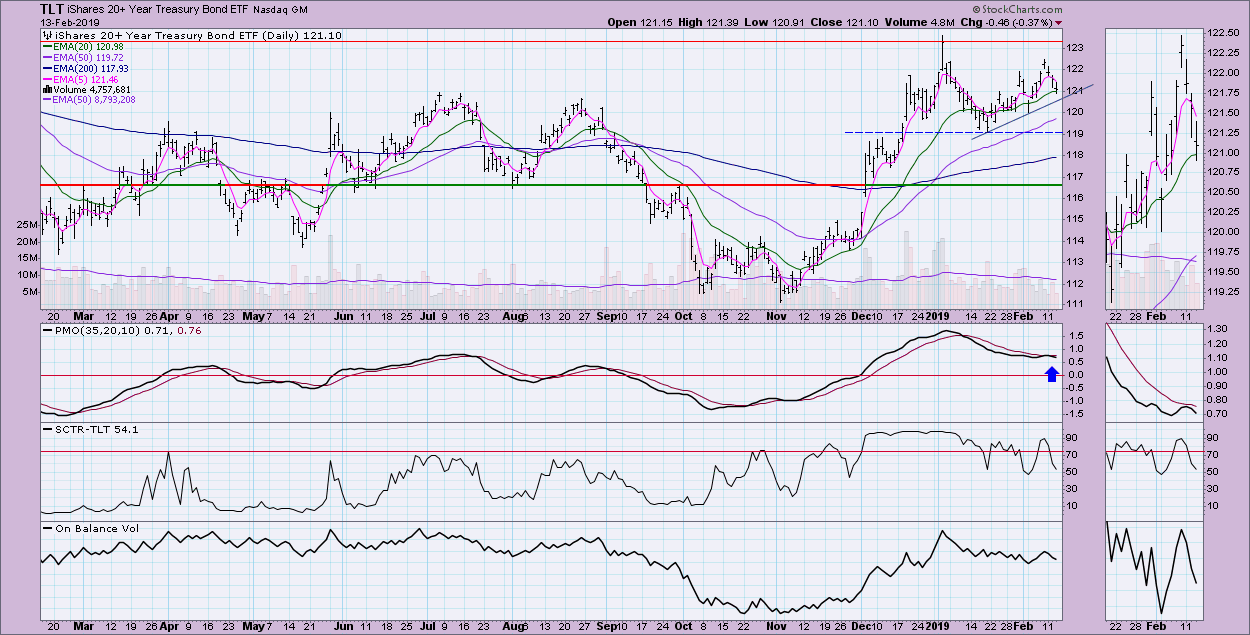
BONDS (TLT)
IT Trend Model: BUY as of 12/6/2018
LT Trend Model: BUY as of 1/2/2019
TLT Daily Chart: The PMO has turned down below the signal line, which is very bearish. However, we saw the same thing a little over a week ago. I don't like the chart. Volume is so-so and the SCTR is going the wrong direction in spite of a rising trend. I don't expect that rising bottoms line to remain and I'm looking for a move back to $119.
Technical Analysis is a windsock, not a crystal ball.
Happy Charting!
- Erin
**Don't miss any of the DecisionPoint commentaries! Go to the "Notify Me" box toward the end of this blog page to be notified as soon as they are published.**
NOTE: The signal status reported herein is based upon mechanical trading model signals, specifically, the DecisionPoint Trend Model. These define the implied bias of the price index based upon moving average relationships, but they do not necessarily call for a specific action. They are information flags that should prompt chart review. Further, they do not call for continuous buying or selling during the life of the signal. For example, a BUY signal will probably (but not necessarily) return the best results if action is taken soon after the signal is generated. Additional opportunities for buying may be found as price zigzags higher, but the trader must look for optimum entry points. Conversely, exit points to preserve gains (or minimize losses) may be evident before the model mechanically closes the signal.
Helpful DecisionPoint Links:
DecisionPoint Shared ChartList and DecisionPoint Chart Gallery
Price Momentum Oscillator (PMO)
Swenlin Trading Oscillators (STO-B and STO-V)
