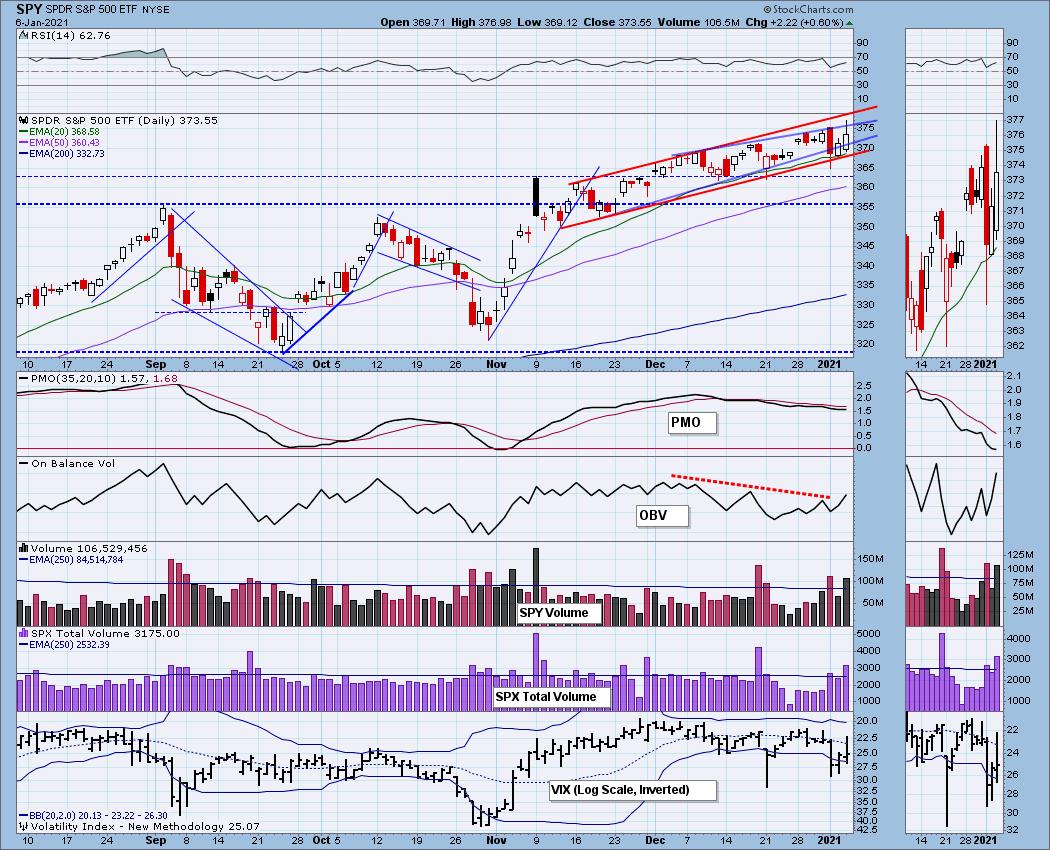
Last night as I studied the 5-month candlestick chart, I debated whether to adjust the trendlines on the rising wedge that we've been monitoring. I was seeing a possible rising trend channel. I still believed there were enough bearish technicals, like an OBV negative divergence and a PMO that had just topped below the signal line, to keep the more bearish rising wedge on the chart. Today it became more clear that we have a longer-term rising trend channel and Carl agrees (he texted me this afternoon!) -- great minds DO think alike.
This puts a much more bullish spin on market behavior. I don't think we are out of the woods, but the situation is less dire than the previous rising wedge implied.
I invite you to read the full DP Alert report on our website DecisionPoint.com. Here is an excerpt regarding some of the concerns that still are out there despite a rising trend channel....
Participation:
The following chart uses different methodologies for objectively showing the depth and trend of participation for intermediate- and long-term time frames.
- The Silver Cross Index (SCI) shows the percentage of SPX stocks on IT Trend Model BUY signals (20-EMA > 50-EMA).
- The Golden Cross Index (GCI) shows the percentage of SPX stocks on LT Trend Model BUY signals (50-EMA > 200-EMA).
- The Bullish Percent Index (BPI) shows the percentage of SPX stocks on Point & Figure BUY signals.
The SCI is continuing its decline. The BPI had a positive crossover, but we've seen this a few times already. I'll be more impressed if it can break its declining trend. The GCI is getting more and more overbought in the long term.


Click here to register in advance for the recurring free DecisionPoint Trading Room! Recordings are available!
We did see an increase in overall participation as many stocks moved above their 20-EMAs. The Stocks > 50/200-EMAs remains overbought, but has moved mostly sideways and has avoided serious negative divergences."

Conclusion: While a rising trend channel is more favorable than a bearish rising wedge, there are still problems with overbought indicators. Additionally, price is perched on the bottom of the channel and the 20-EMA so it is definitely vulnerable to retesting the bottom of the channel. The question for today is whether this was a buying exhaustion or a buying initiation. Subscribe today to the DecisionPoint Alert and you can find out!
Happy Charting! - Erin
erin@decisionpoint.com
Technical Analysis is a windsock, not a crystal ball.
Helpful DecisionPoint Links:
DecisionPoint Alert Chart List
DecisionPoint Golden Cross/Silver Cross Index Chart List
DecisionPoint Sector Chart List
Price Momentum Oscillator (PMO)
Swenlin Trading Oscillators (STO-B and STO-V)
DecisionPoint is not a registered investment advisor. Investment and trading decisions are solely your responsibility. DecisionPoint newsletters, blogs or website materials should NOT be interpreted as a recommendation or solicitation to buy or sell any security or to take any specific action.
