Prior to this week, energy had seen its strongest rebound since topping in June 2014. But a long-term negative divergence and slowing volume suggested the rally was long in the tooth. After hitting nearly 72.00, the XLE has retreated and the energy bulls will now be tested. During an uptrend, I look to the rising 20 day EMA for support but once a negative divergence prints, my preference is to await a 50 day SMA test, which the XLE saw on Thursday. That also coincides with recent price support near 66.00. Here's the chart:
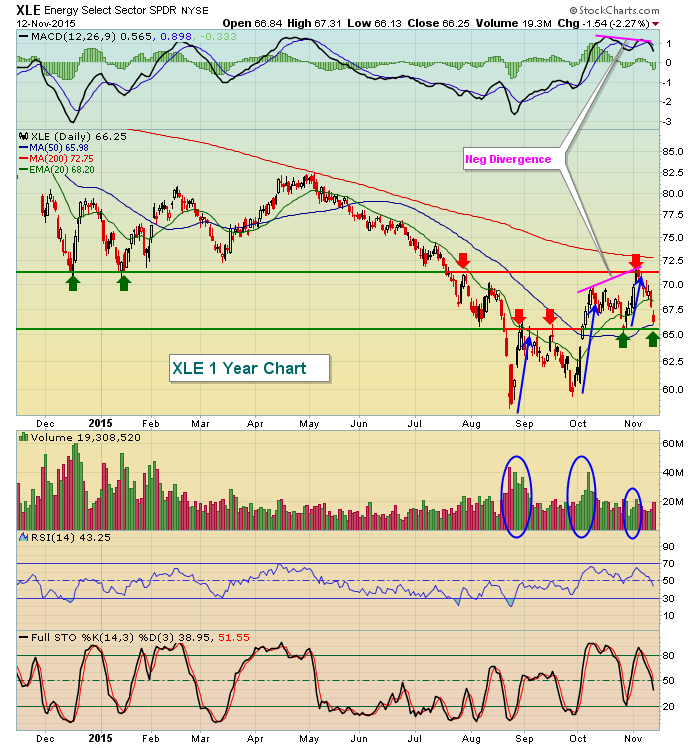
The red arrows mark key price resistance while the green arrows mark key price support. Should 66.00 support fail to hold, look to gap support near 64.00. Failure to hold these levels would likely lead to a potential triple bottom beneath 60.00. Price momentum wasn't the only issue here, however. Check out the drop in volume (third blue circle) on the XLE during the last rally. While volume analysis can be a bit misleading on ETFs, it does paint a second picture of slowing momentum. Energy will be a key area to watch tomorrow and early next week.
Happy trading!
Tom
