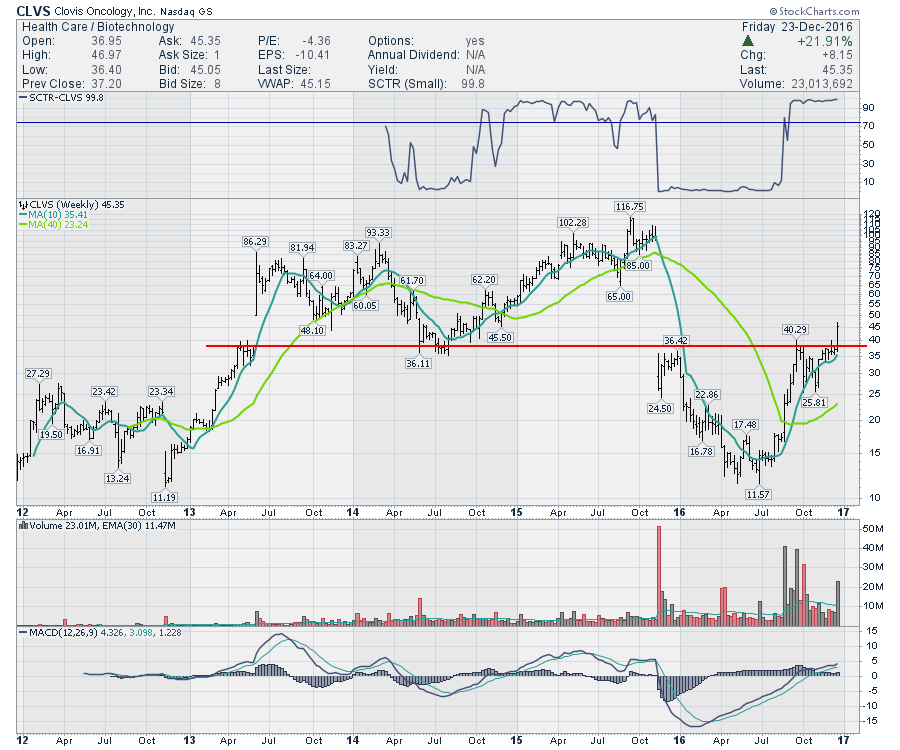
Clovis Oncology (CLVS) had a big week as a Christmas present for investors. But the chart tells us another story. Back in 2013, the stock gapped above $40 and went on a run to $86. After a tumultous pullback to $35, the stock went on another run to $116. Late in 2015, the stock lost 75% in a day. A really bad day at the office. After losing another 50% from there, the stock finally found a bottom. This week, the stock pushed back through the major support / resistance area around $38. With volatility so disruptive, a small position size is warranted, but the current push looks to be sustainable and there is lots of upside above.
 It is a small cap so it swings like the wind. If you are looking for faster moves, this one seems to offer that, both ways.
Good trading,
Greg Schnell, CMT, MFTA.
