After inching higher for six weeks with intermittent corrective bouts, Indian equities finally took a breather and succumbed to a corrective move as it ended the week on a negative note. In the previous weekly technical outlook, it was categorically mentioned that the markets remain prone to corrective retracement. In line with this analysis, the headline index Nifty 50 saw a meaningful technical retracement from higher levels. The trading range expanded on the expected lines with the index oscillating in a 620.-5 points range. While ending the week near its low point, the benchmark index closed with a net weekly loss of 470.20 points (-2.09%).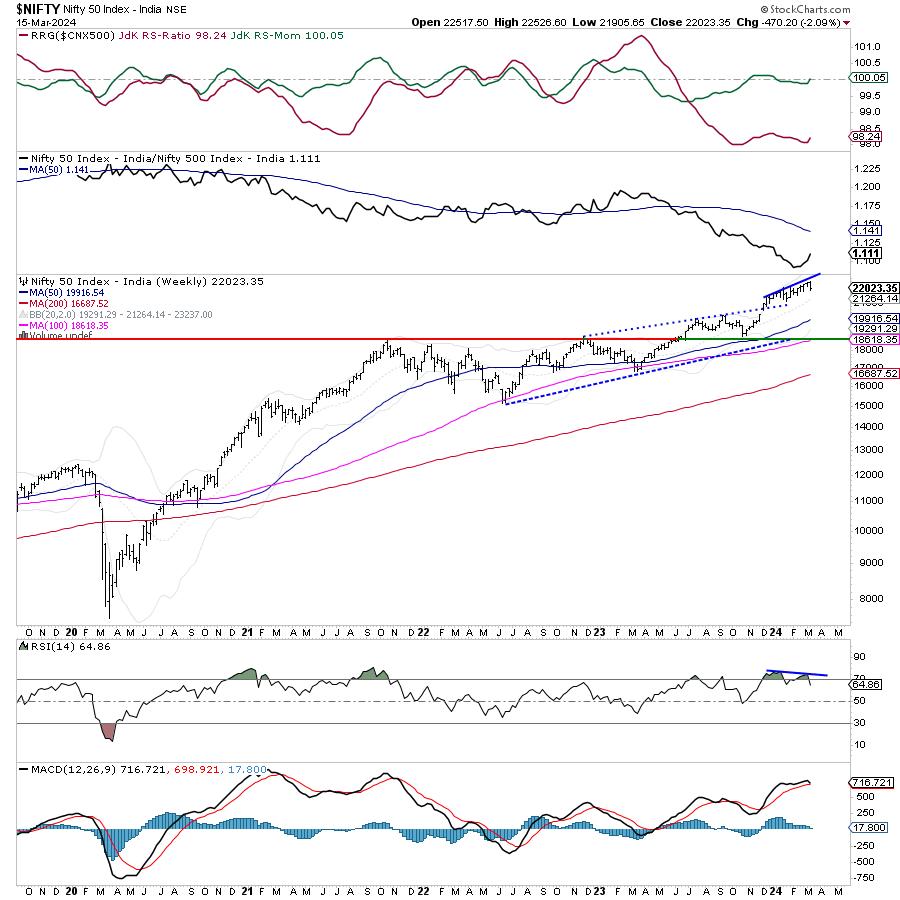
The technical setup does not paint a buoyant picture; given the previous week's price action, we can now consider the high of 22525 as an intermediate top for the markets unless taken out convincingly. Furthermore, there is also an emergence of a bearish divergence of the RSI on the weekly charts that may hint at the corrective mood of the markets persisting for some more time. The most important pattern support comes in the upper edge of the rising channel that the Nifty broke above, which also converges with the 20-week MA placed well below at 21264. The markets have a wider range to oscillate over the coming weeks.
The coming week may see a tepid start; the markets may show mild technical rebounds but may largely stay tentative. The levels of 22300 and 22410 may act as potential resistance points; the supports come in at 21900 and 21680 levels.
The weekly RSI stands at 64.86; it has formed a fresh 14-period low which is bearish. It shows a bearish divergence of the RSI against the price. The weekly MACD stays positive but it sits on the verge of a negative crossover as evidenced by a sharply narrowing Histogram.
An occurrence of a large candle at the high point following a significant upmove also increases the possibility of the uptrend getting temporarily disrupted.
The pattern analysis of the weekly charts shows that the Nifty which had broken out from a rising channel when it crossed above 20800 levels is showing signs of fatigue. The levels of 22525 can now be regarded as a temporary top unless taken out convincingly; the big black candle at the top also hints at a temporary disruption of an upmove. The nearest pattern supports staying significantly below current levels.
All in all the coming week will see the markets wearing a defensive look; there are greater chances that it continues facing corrective pressure with each technical rebound that it may get. Defensive pockets like IT, Pharma, and FMCG may see some notable improvements in their relative strength, resulting in these groups either showing resilience or relative outperformance against the broader markets. It is recommended to approach the markets cautiously and curtail leveraged exposure. A cautious outlook is advised for the coming week.
Sector Analysis for the coming week
In our look at Relative Rotation Graphs®, we compared various sectors against CNX500 (NIFTY 500 Index), which represents over 95% of the free float market cap of all the stocks listed.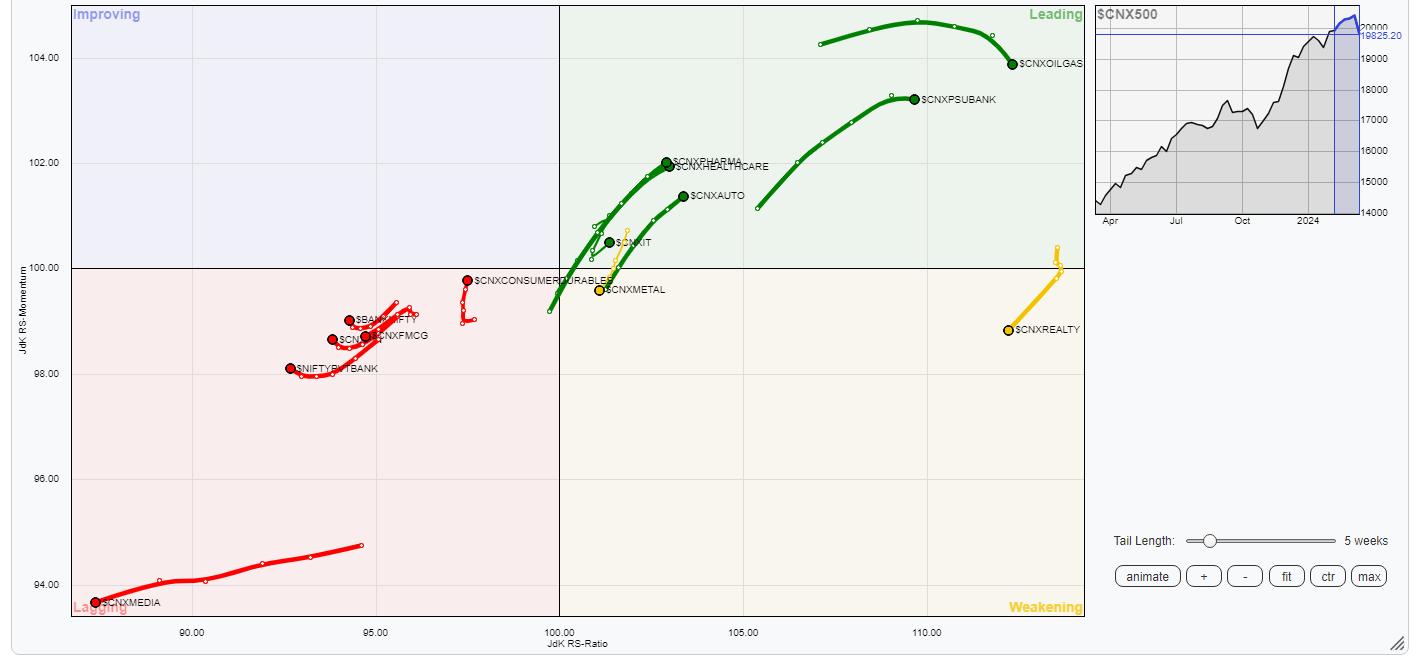
Relative Rotation Graphs (RRG) show Nifty Commodities, Energy, and PSE sectors are inside the leading quadrant but they are slowing down in their momentum. Besides this, Nifty Pharma, PSU Bank, Infrastructure, IT, and Auto Indices are inside the leading quadrant as well. These groups are likely to relatively outperform the broader markets.
The Nifty Metal Index has rolled inside the weakening quadrant. The broader Nifty MidCap 100 index is also inside the weakening quadrant.
The Nifty Media Sector Index is seen languishing inside the lagging quadrant along with FMCG Index. However, besides being inside the lagging quadrant, the Financial Services, Banknifty, and Services Sector Index are seen improving their relative momentum against the broader markets.
The Nifty Consumption Index has rolled inside the improving quadrant.
Important Note: RRG™ charts show the relative strength and momentum of a group of stocks. In the above Chart, they show relative performance against NIFTY500 Index (Broader Markets) and should not be used directly as buy or sell signals.
Milan Vaishnav, CMT, MSTA
Consulting Technical Analyst
www.EquityResearch.asia | www.ChartWizard.ae