In the previous technical note, it was categorically mentioned that, while the markets may attempt to inch higher, they may not form anything beyond minor incremental highs and could largely continue to stay under consolidation. In line with the analysis, the Nifty did form a new lifetime high, but eventually continued to consolidate and avoid any strong move on the upside. The markets had a modest trading range; the index oscillated in a 315-point range over the past five sessions. The volatility slipped further; Indiavix came off by 11.65% to 11.34. The headline index closed with a modest weekly gain of 186.80 points (+0.84%).
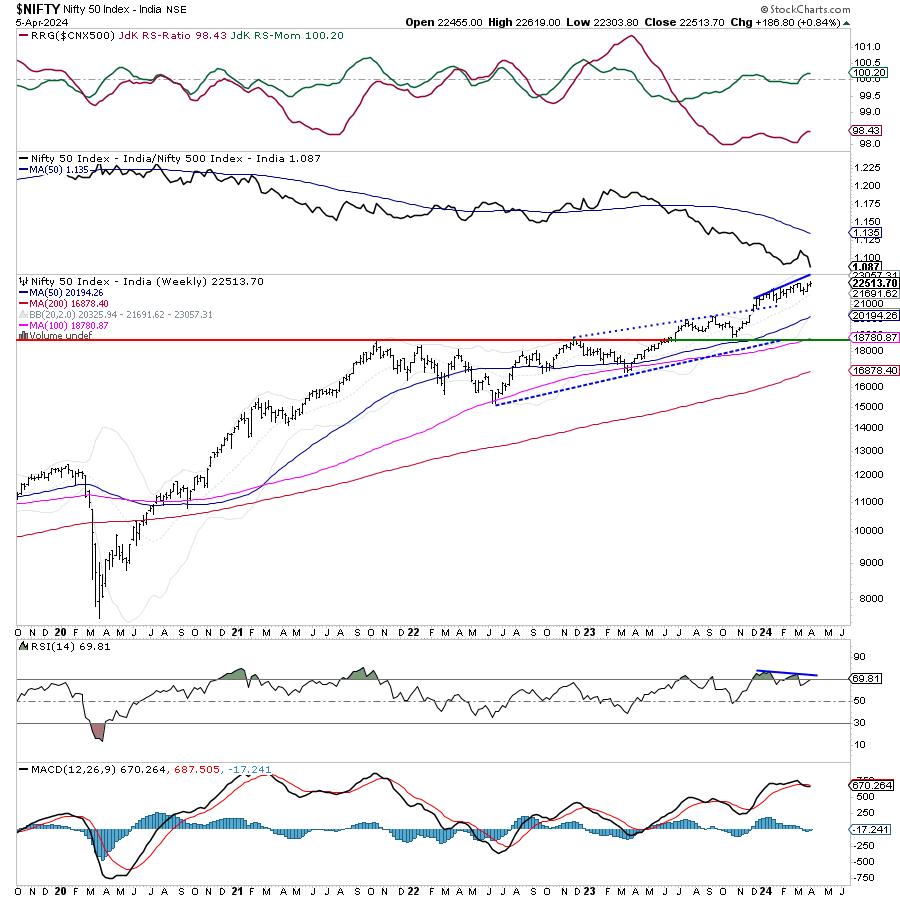
From a technical perspective, the Nifty will need to move past the 22550-22600 zone with a strong thrust for any sustainable move to take place. Further, the Options data also suggests that strong Call OI built up in this zone may continue to pose resistance for the markets. A sustainable uptrend would commence only after the Index moves past this zone; until this happens, we may see the markets finding selling pressure at higher levels, increasing the need for vigilant protection of profits until a fresh breakout is achieved.
A quiet start is expected to the new week; the levels of 22600 and 22790 would act as potential resistance levels. Supports come in at 22380 and 22100 levels. The trading range is likely to stay modest over the coming week.
The weekly RSI is 69.81; it continues to show a mild bearish divergence against the price. The weekly MACD is bearish and trading below its signal line.
A spinning top occurred on the candles. Such candles typically have small real bodies because of how little difference there is between the open and close price, showing the indecisiveness of the market participants. Such formations, if they occur near the highs, often have the potential to stall the upmoves.
The pattern analysis of the weekly charts shows the markets being in a firm uptrend. However, that being said, the markets are also exhibiting signs of fatigue at higher levels. They are also showing a minor loss of internal strength as they mark incremental highs along with minor negative divergences. All and all, while the trend continues to stay intact, there is a possibility of the markets staying under some ranged consolidation. The nearest support for the Nifty exists at 20-week MA which is placed at 21691.
All in all, we are likely to see some risk-off setup in the markets. We can expect defensive pockets like Pharma, IT, FMCG, etc., to offer better relative strength than the others. However, the banking space is likely to stay resilient as well. It is strongly recommended that, unless a strong breakout is achieved, with Nifty moving past the 22550-22600 zone via a thrust, all up moves must be used to protect profits at higher levels. Low levels of VIX remain a concern and may infuse some spikes in volatility. A cautious approach with one eye on the protection of gains is advised for the coming week.
Sector Analysis for the Coming Week
In our look at Relative Rotation Graphs®, we compared various sectors against CNX500 (NIFTY 500 Index), which represents over 95% of the free float market cap of all the stocks listed.
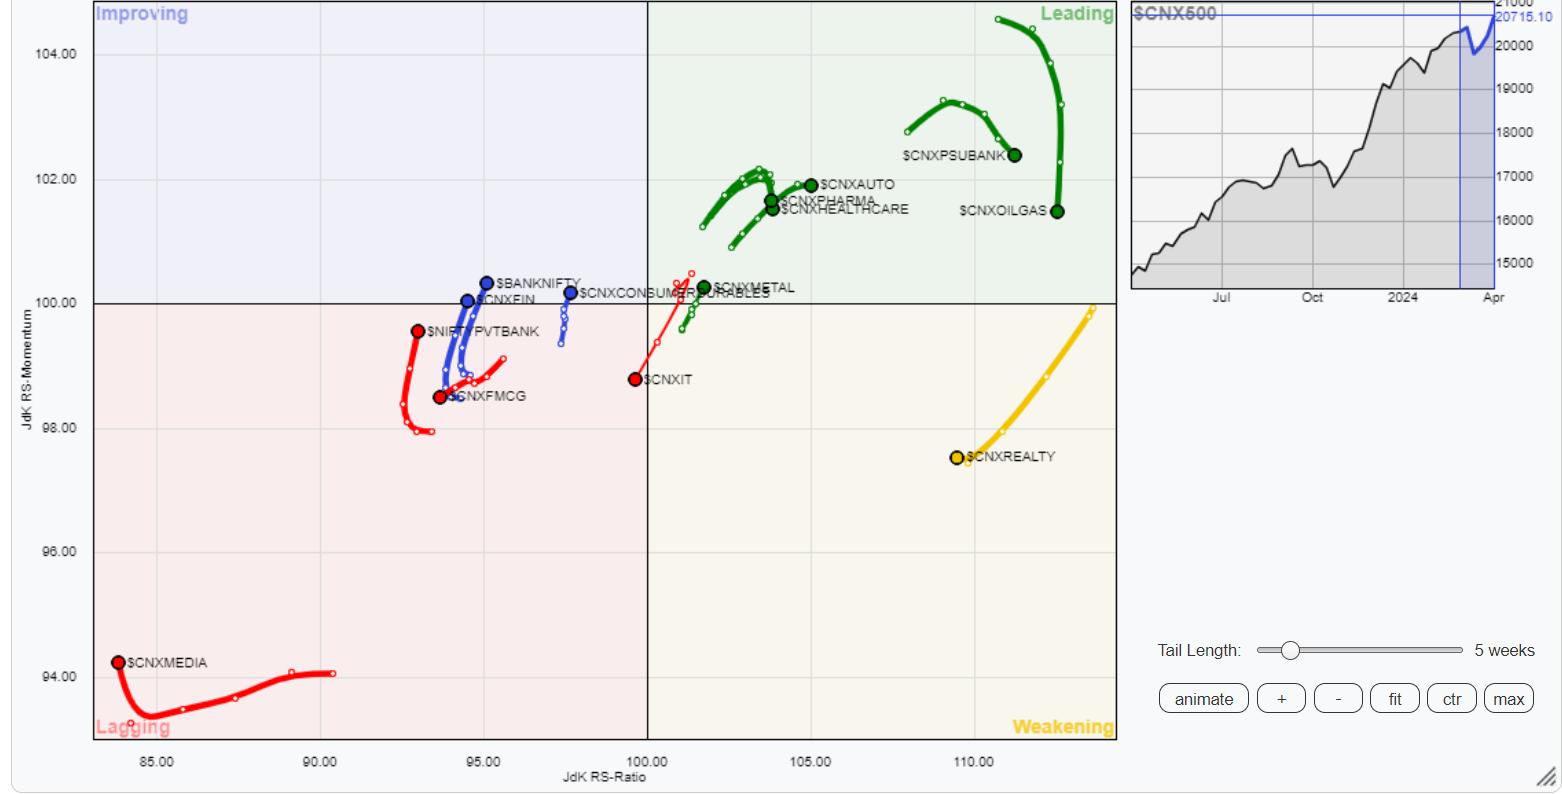
Relative Rotation Graphs (RRG) show that the Nifty Commodities, Energy, and Infrastructure indices are inside the leading quadrant. However, they are seen giving up on their relative momentum. Besides these groups, PSU Banks, Pharma, and Auto groups are inside the leading quadrant. The Metal index has also rolled inside the leading quadrant; these groups are set to relatively outperform the broader markets.
The Nifty PSE index has rolled inside the weakening quadrant. Besides this, the Midcap 100 and the Realty Indices are also inside the weakening quadrant.
The Nifty IT has rolled inside the weakening quadrant. The Nifty FMCG and Media indices also continue to languish inside the weakening quadrant. The Services sector index is also inside this quadrant but it is seen improving on its relative momentum.
While the Nifty Consumption Index is inside the improving quadrant, the BankNifty and Financial Services index has rolled inside the improving quadrant, hinting at a potential end to their relative underperformance.
Important Note: RRG™ charts show the relative strength and momentum of a group of stocks. In the above Chart, they show relative performance against NIFTY500 Index (Broader Markets) and should not be used directly as buy or sell signals.
Milan Vaishnav, CMT, MSTA
Consulting Technical Analyst
www.EquityResearch.asia | www.ChartWizard.ae