TAKEAWAYS
- Value stocks are taking over the lead from Growth
- When Value beats Growth, the S&P 500 usually does not do too well
- The strength of Value is surfacing across all size segments of the market
- Important support areas for SPY at 480 and 460
Value Taking the Lead from Growth
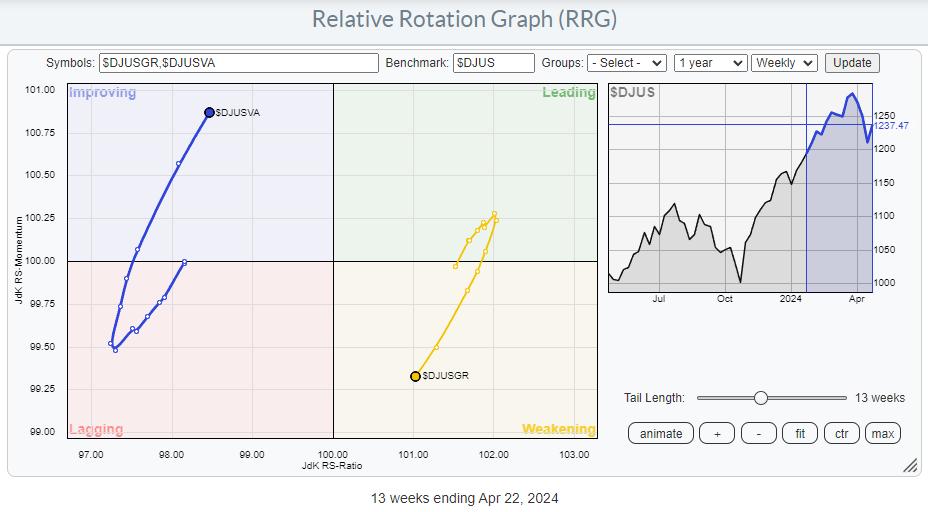
The weekly RRG above shows the rotation for Growth vs. Value stocks, with the DJ US index as the benchmark. The recent rotation clearly shows the rotation out of growth into value taking shape and picking up steam. For now, Growth is still positioned on the right-hand side of the RRG, but the $DJUSGR tail is rapidly heading toward the lagging quadrant at a negative RRG-Heading.
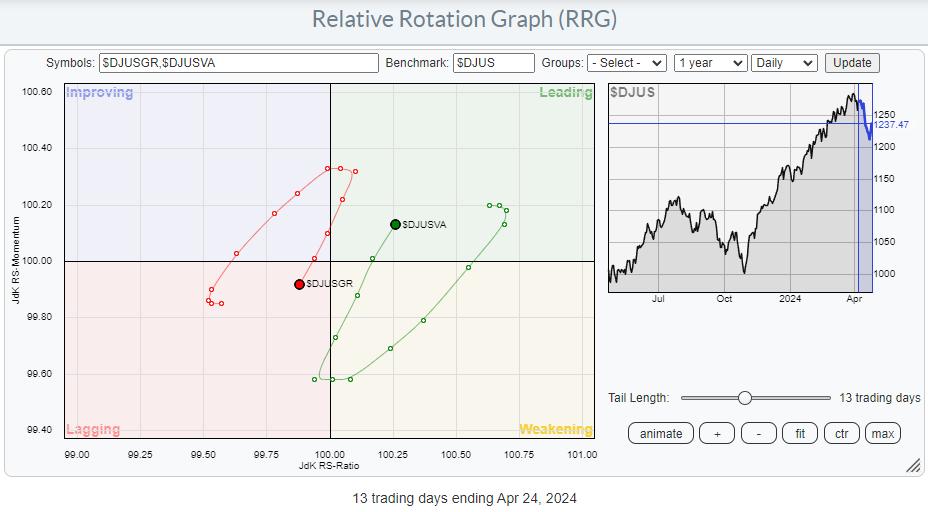
The daily version of this RRG underscores the preference for Value stocks.
The $DJUSVA tail dropped into the weakening quadrant after a rotation through leading since mid-March, and sharply hooked back up after one day inside the lagging quadrant, now returning into the leading quadrant. This supports a further strengthening for the Value tail on the weekly time-frame.
$SPX Usually Tracks Growth/Value Ratio Well
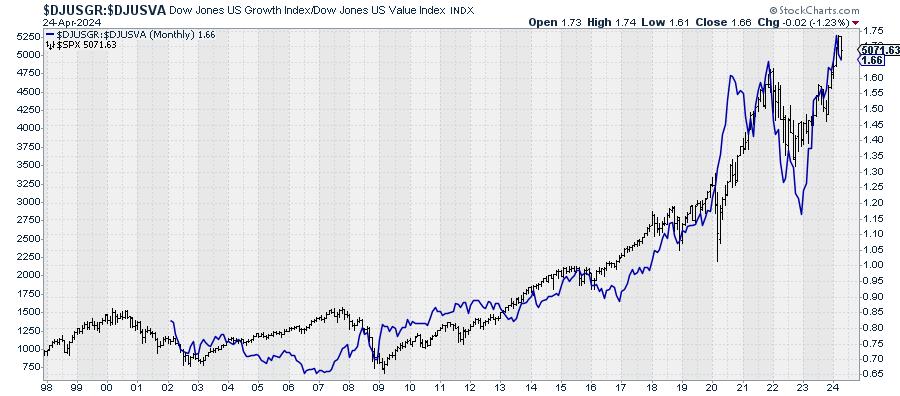
Plotting the Growth/Value ratio on top of the price chart for $SPX shows that they have tracked each other quite well over time. This is a monthly chart, so we're discussing long-term trends here. The main takeaway here is that the S&P usually does well when the growth/value ratio goes up and less well when the ratio moves lower.
With the RRG currently showing a strong preference for Value stocks, caution is warranted, as this might be the precursor for a further decline in the S&P 500 itself.
Preference for Value over Growth Appears Across All Size Segments
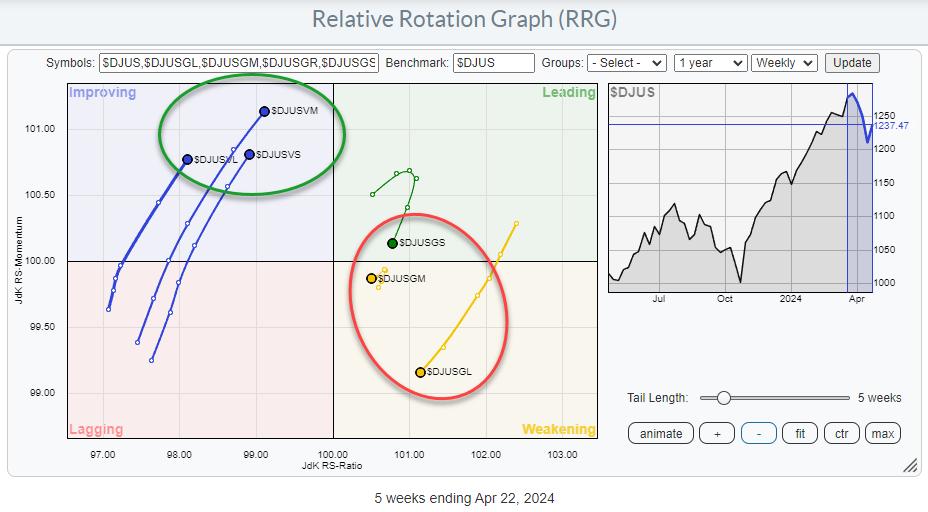
When we break down the Growth and Value segments into their respective size buckets, we get the RRG above. This shows that value beats growth across all size segments. Large-, mid-, and small-cap Value tails are all inside the improving quadrant and moving at a positive RRG-Heading.
The Growth tails are slightly more divided, but all three are on a negative RRG-Heading, with large-cap Growth showing the fastest deterioration. Mid-cap is the most stable, with its short tail just inside the weakening quadrant, while small-cap Growth stocks have rolled over inside the leading quadrant and are starting to head lower on both scales.
All in all, this underscores the need for caution regarding price developments for the S&P 500 in the coming weeks.
5%-10% Downside Risk within Long-Term Uptrend
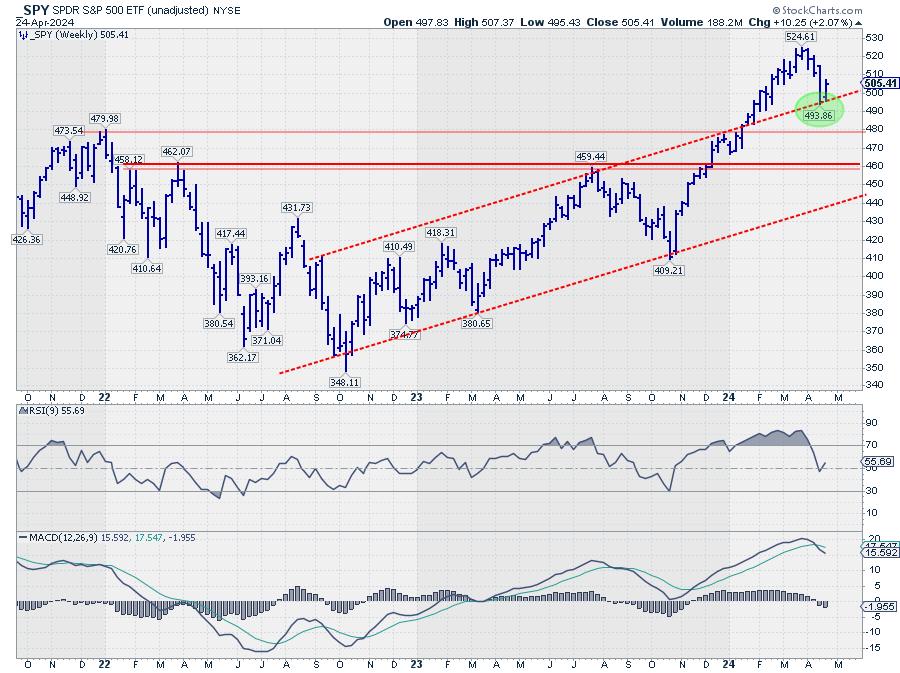
On the weekly chart, SPY found support at the level of the former rising resistance line at around 494. More important support is found at the level of the January 2022 peak at 480, and, in case that breaks, the area around 460 will provide another solid support area. With the current longer-term trend of higher highs and higher lows still firmly in place, we have to conclude that the uptrend is still in play.
At the same time, however, we have to realize that, within that uptrend, a 5-10% decline is perfectly possible.
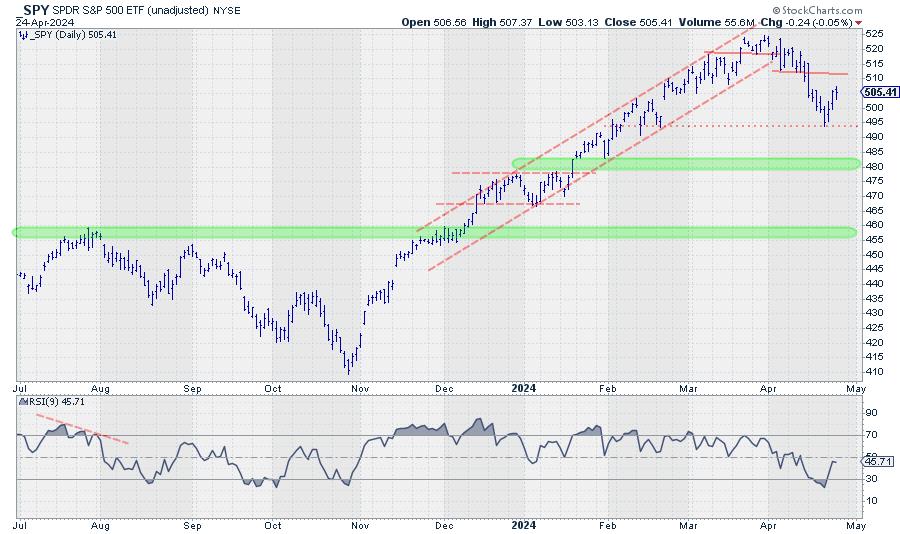
The more detailed daily chart of SPY shows that the decline from the recent peak at 524 back to the low near 495, which is one move lower on the weekly chart, is already showing lower highs and lower lows, which means that rallies now have to be seen as up-ticks within a downtrend until this structure changes again.
The green-shaded areas represent the support levels mentioned on the weekly chart. New buying opportunities within the long-term uptrend should start to arise in these ranges.
Rotation into Defensive Sectors Confirms Risk-Off
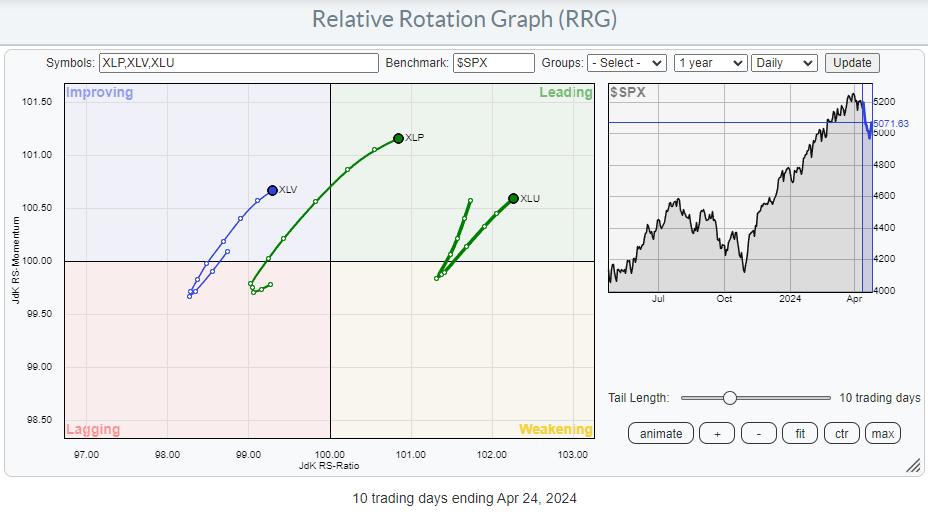
Finally, the daily RRG for defensive sectors shows a rapid rotation into Healthcare, Consumer Staples, and Utilities in the last two weeks of trading, which confirms the need for caution in the coming weeks.
#StayAlert, --Julius
Julius de Kempenaer
Senior Technical Analyst, StockCharts.com
Creator, Relative Rotation Graphs
Founder, RRG Research
Host of: Sector Spotlight
Please find my handles for social media channels under the Bio below.
Feedback, comments or questions are welcome at Juliusdk@stockcharts.com. I cannot promise to respond to each and every message, but I will certainly read them and, where reasonably possible, use the feedback and comments or answer questions.
To discuss RRG with me on S.C.A.N., tag me using the handle Julius_RRG.
RRG, Relative Rotation Graphs, JdK RS-Ratio, and JdK RS-Momentum are registered trademarks of RRG Research.
