The following is an excerpt from the US Stock Market section of the May 12th "Keys To This Week" report, which also covers US Stock Market Sectors, US Interest Rates, the US Dollar, and economically influential commodities like copper, gold and crude oil.
The US Stock Market
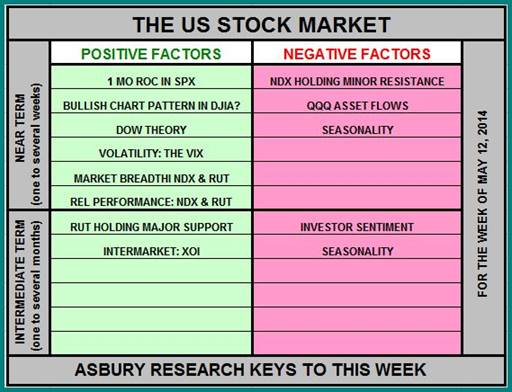
This Week our table retains the past 3 weeks’ Positive alignment of key Near Term market factors for the US stock market. Note that the Near Term Positive quadrant of our table is the most populated part of it, which suggests a bullish bias heading into this week. The US market begins the week with the Tech-heavy NASDAQ 100 (NDX) and small cap Russell 2000 (RUT) amid favorable conditions to both rise on an outright basis and outperform the broad market S&P 500 (SPX) between now and early in the 3rd Quarter, despite seasonal headwinds. Moreover, an historically low VIX, a bullish confirming signal according to Dow Theory, and an unmet upside target in the AMEX Oil Index (XOI) 5% above the market also suggest that one more leg higher is likely in the US stock market before a corrective decline potentially emerges during the 3rd Quarter.
However, several things have to occur this month to help confirm the near term bullish argument including: 1) a sustained rise above 16,588 in the Dow Industrials (DJIA), a 2) sustained rise above 3617 resistance in NDX 3) while RUT remains above 1079 support, 4) and expanding daily assets in the PowerShares QQQ ETF.
Listed in the order of their importance and expected impact on market direction
1. Momentum: Monthly Rate of Change (ROC), S&P 500. NEAR TERM BULLISH. The S&P 500′s 1-month rate-of-change (ROC, the percentage change between the most recent price and the price 21 day ago) turned back to positive (bullish) on Wednesday May 7th, which indicates that the February US broad market advance is resuming.
2. Chart Patterns: Dow Jones Industrial Average (DJIA). MINOR DECISION POINT, TURNING NEAR TERM BULLISH? Chart 1 below plots DJIA daily over the past year and highlights a chart pattern, a triangle, that has emerged due to the index’s sideways trade — indicating temporary investor indecision — since the beginning of the year. A sustained rise above the upper boundary of the pattern at 16,588 would confirm a bullish breakout that targets an additional 6% rise to 17,500.
3. Price & Trend: Dow Theory. TURNING NEAR TERM BULLISH. The green highlights in Chart 2 below point out that the March 7th new closing high in the Dow Jones Transportation Index (DJTA) was confirmed by a new closing high in the Dow Industrials (DJIA) last week which, according to Dow Theory, clears the way for new highs in both indexes and in the broader US market.
4. Support/Resistance: Russell 2000 Index (RUT). MINOR DECISION POINT, NEAR TO INTERMEDIATE TERM BULLISH. Although the financial media made a fuss last week over RUT’s decline below its 200-day moving average, the green highlights in Chart 3 below show that the more important level is at 1083 to 1079, which represents the November 7th and February 5th benchmark lows. As long as this support continues to hold, we will assume that the index’s current major uptrend is still intact and likely to eventually resume.
5. Support/Resistance: NASDAQ 100 Index (NDX). MINOR DECISION POINT, NEAR TERM BEARISH. Chart 2 of our May 5th Keys To This Week showed that NDX was — and still is — hovering just below key overhead resistance at 3604 to 3617, which represents the index’s 50-day moving average (minor trend proxy) and the 61.8% retracement of its March-April decline. A sustained rise above 3604 to 3617 would be necessary to indicate that this market-leading index has resumed its larger 2013 advance.
6. ETF Asset Flows: PowerShares QQQ ETF. NEAR TERM BEARISH. Chart 4 below shows that the daily total assets invested in QQQ contracted below their 21-day (monthly, red line) moving average on March 13th and have remained below it since, which has facilitated the current decline in the NASDAQ 100 (NDX, upper panel). A sustained rise by these assets, back above their monthly moving average, would be necessary to fuel a new leg higher in the QQQs and in the NASDAQ 100.
7. Volatility: The CBOE Volatility Index (VIX). NEAR TERM BULLISH. Chart 5 below shows that the VIX has been trading completely below its 50-day moving average since April 29th, indicating an extreme level of investor complacency that has coincided with US broad market advances during the past year. It would take a sustained rise in the VIX, like those that occurred in December, January-February, and in April as shown by the red highlights, to indicate that there is enough investor fear in the marketplace to facilitate a decline in the S&P 500 (upper panel).
8. Investor Sentiment: NEAR TO INTERMEDIATE TERM BEARISH. The vast majority of the 18 investor sentiment metrics that we track continue to warn of an upcoming 1-2 month decline in the US stock market.
9. Market Breadth: NASDAQ 100 (NDX), Russell 2000 (RUT). NEAR TERM BULLISH. Chart 5 of our April 21st Keys To This Week showed that the percentage of Russell 2000 constituent stocks trading above their 50-day moving average was rebounding from near 20%, a level that had coincided with important bottoms in the small cap index on April 15th and during November and June 2012. More recently, Chart 5 of last week’s report showed that the percentage of NASDAQ 100 constituents trading above their 50-day MA is also rebounding from 20%. Since technology and small cap typically lead the US broad market both higher and lower, these extreme conditions in market breadth establish an ideal environment for another technology and small cap-led US broad market advance to begin this month.
10. Relative Performance: NASDAQ 100 (NDX) and Russell 2000 (RUT) Indexes. NEAR TO INTERMEDIATE TERM BULLISH. Chart 5 of our April 28th Keys To this Week last week’s report showed that the NASDAQ 100 (NDX) was — and still is — at quarterly oversold extremes versus the S&P 500, and that previous instances of this have coincided with the past four significant outperformance trends by NDX. Chart 6 below shows that, through Friday, the Russell 2000 (RUT) is also at quarterly oversold extremes versus SPX that have historically led periods of relative outperformance by this small cap index. Since technology and small cap stocks typically lead the US broad market both higher and lower, how NDX and RUT respond to these favorable conditions to outperform will be seen as an indirect indication of whether or not the US broad market resumes its current uptrend or begins a corrective decline.
11. Intermarket Relationships. AMEX Oil Index (XOI). NEAR TO INTERMEDIATE TERM BULLISH. As we have displayed and discussed throughout much of 2013, XOI is in the midst of a major bullish trend that targets an eventual, additional 5% rise to 1700 that will remain valid above critical underlying support at 1240. XOI finished last week at 1615. Considering the tight and stable positive correlation between XOI and the S&P 500 over the past 20 years, an upcoming 5% advance in the former indirectly suggests the likelihood of a coincident, similar advance in the US broad market index.
12. Seasonality: NEAR TO INTERMEDIATE TERM BEARISH. Chart 6 of last week’s report showed that the first 3 weeks of May (this is the 2nd week) are the 5th, 4th and 2nd weakest of the entire 2nd Quarter based on data since 1957. More charts and detail on annual, quarterly and monthly seasonal trends in 17 global asset prices including equities, benchmark interest rates, foreign exchange, and key commodity prices based on historical data going back to the 1950s, is available in our May Global Seasonal Analysis report.


John Kosar, CMT
Director of Research
Asbury Research LLC
Web: http://asburyresearch.com/