
Monitoring purposes SPX: Covered short on 5/27/14 at 1911.91 loss 1.42%. Short SPX on 5/19/14 at 1885.08.
Monitoring purposes GOLD: Gold ETF GLD long at 173.59 on 9/21/11
Long Term Trend monitor purposes: Flat
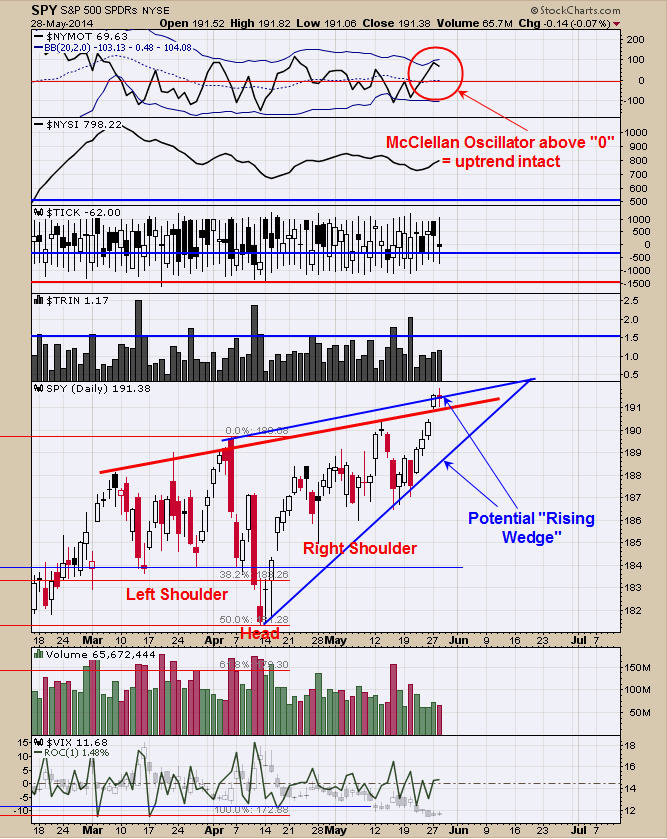
The “Three Drives to Top” pattern that we though was forming appears to have vanished and something else is going on. We have two possible scenario’s, one is that the pattern forming is a Head and Shoulders bottom where the Head is the April low; two the pattern forming is a “Rising Wedge”. The Head and Shoulders bottom pattern is bullish and the “Rising Wedge” is bearish. One of the patterns should identify itself as the true correct pattern. We have to say as long as the McClellan Oscillator stays above “0” the uptrend is intact. We are staying neutral for now until the evidence becomes clear which direction the market is heading.
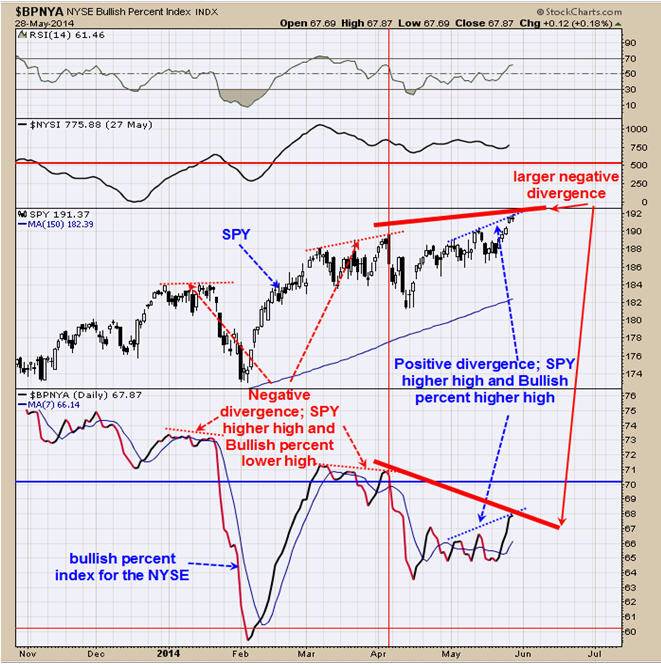
The bottom window is the bullish percent index for the NYSE. The bullish percent index measures the percent of buy signals in the NYSE by the point and figure method. At the previous short term tops in the SPY in January and March of this year the SPY made higher highs and the Bullish Percent index made lower highs and a negative divergence. Since early May the SPY made higher highs and the Bullish Percent index also made higher highs supporting the uptrend in the SPY. We have drawn a solid red line from early May to current high both in the SPY and Bullish Percent index which is a large negative divergence and we don’t know at this time that large divergence will have a negative affect on the market but something we are watching. As long the McClellan Oscillator stays above “0” (current reading near +70) we have to stay uptrend is intact.
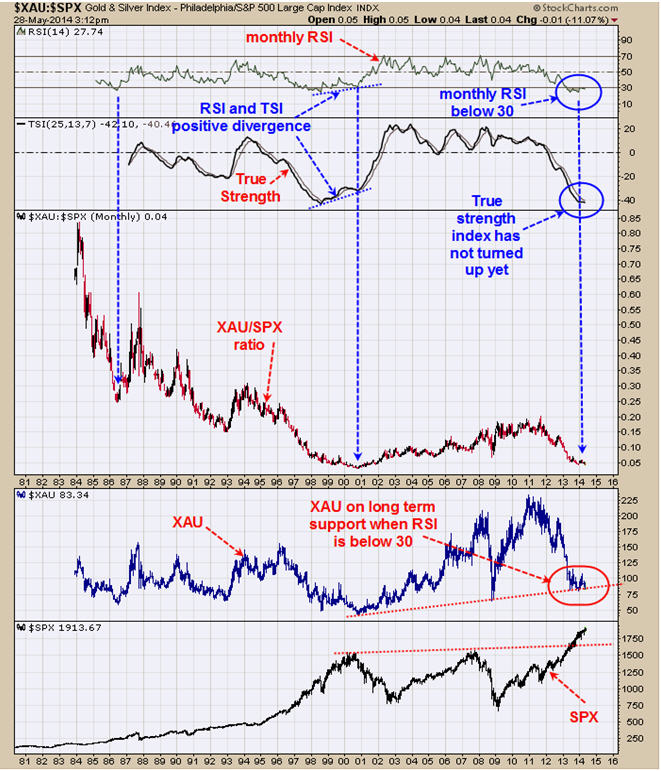
The above chart is on the monthly timeframe and dates back to 1981. The chart in the middle is the XAU/SPX ratio and the RSI and True Strength index (TSI) are for this ratio. When the XAU/SPX ratio is rising than XAU is outperforming the SPX and vice versa. When the RSI of the XAU/SPX ratio gets below 30 (current reading is 27.74) than this ratio is nearing a turn up when the XAU will start to outperform the SPX. Notice that the XAU is on long term support line (second window up from bottom) where the RSI of the XAU/SPX is below 30 and suggests that support may hold. So far the XAU/SPX ratio has not turned up but is in oversold levels with the RSI and TSI. Seasonality doesn’t turn bullish for Gold until July and market may see some weakness until then.
Tim Ord, Editor
16928 Van Dorn Street
Walton, Nebraska 68461
www.ord-oracle.com
(402) 486-0362.
tim@ord-oracle.com