
Monitoring purposes SPX: Neutral
Monitoring purposes GOLD: Gold ETF GLD long at 173.59 on 9/21/11
Long Term Trend monitor purposes: Flat
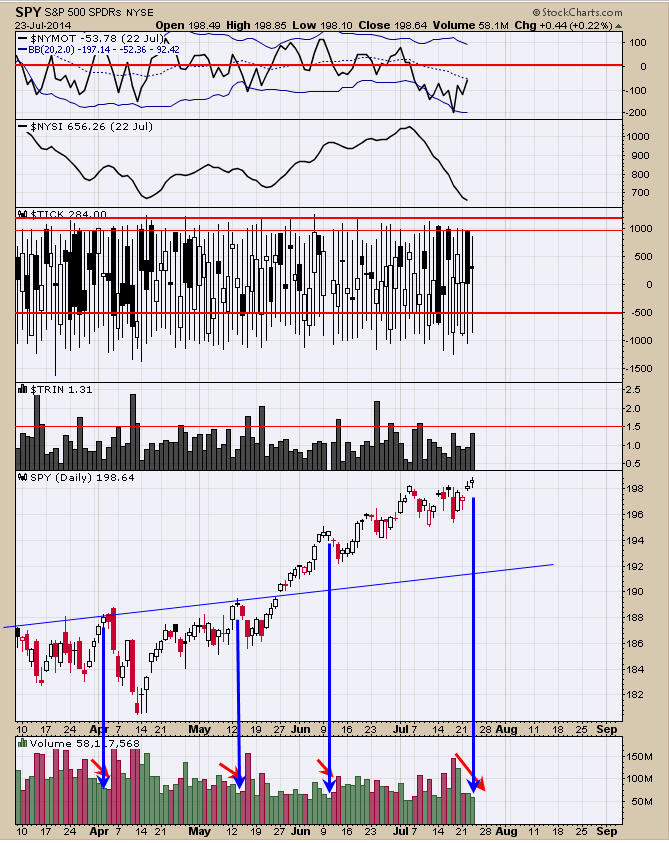
The TRIN nor the TICK readings are giving much of information right now so we have to look at other indicators. The chart above goes back to mid March. The SPY has failed to rally through to the upside when the volume drops as it moved higher. The last three tops are identified with Blue and red arrows and notice we have this situation again, where market is moving higher and volume is dropping. Its also worth noting that according to the Wyckoff method of trading, market volume should expand as market trades above previous high. This technique is referenced to by the Wyckoff method as “SOS” which means “Sign of Strength” and refers to wide price spread and above average volume. None of those conditions are present on the current break to new highs. We are still expecting the market to pull back here. Our stance on the market is still neutral.
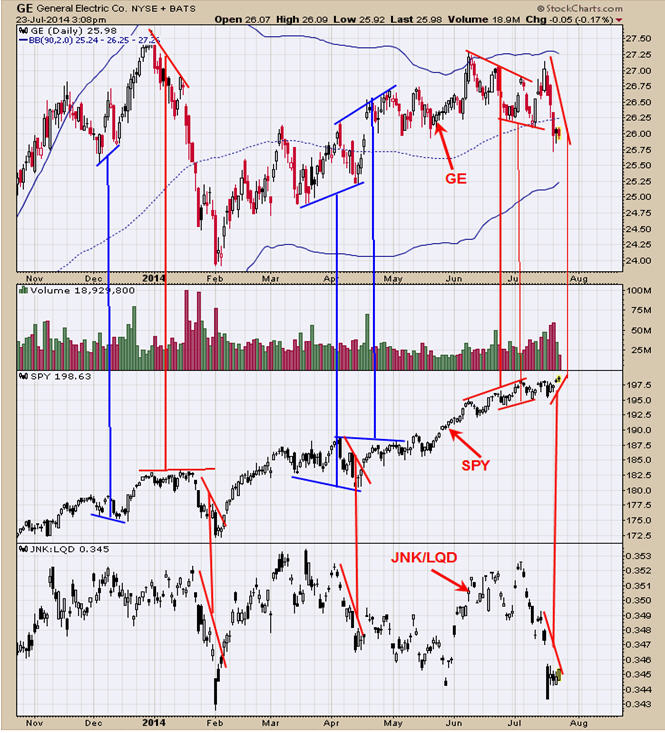
The bottom window is the JNK/LQD ratio. JNK is the ETF for junk bonds and LQD is investment grade bonds. When this ratio is rising, than JNK is outperforming LQD and investors are seeking risk and a bullish sign for the market. When this ratio is declining, than investors are seeking safety and a bearish sign for the market. The rally in the SPY over the last several days was companied by a declining JNK/LQD ratio and a bearish divergence. The top window General Electric (GE). It is said “where GE goes so goes the market”. We have pointed out positive divergence in GE compared to SPY in blue and bearish divergence in GE compared to SPY in Red. Over the last several days GE has declined and SPY has rallied and one index is going in the wrong direction and previous example show that GE has been the correct direction. We don’t have it shown but the Presidential Cycle show that start of July through mid September the market has a down cycle on average. There are divergences short term.
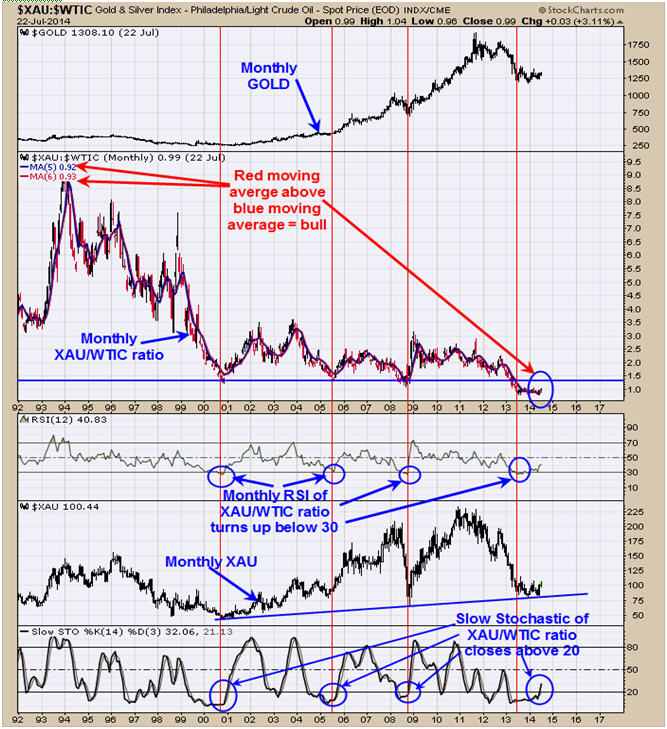
The chart above is the monthly XAU/WTIC ratio going back to 1992. The XAU is the gold bug index and the WTIC is the Philadelphia Light Crude Gold spot index. Over the years this ratio picked out the major lows in Gold stocks. It picked the low in 2000, 2005, 2008 and is now signaling another major buy signal. The signals are generated when the RSI of the monthly XAU/WTIC turns up from below 30; the Slow Stochastics of the XAU/WTIC ratio closed above 20 and the moving averages of 5 and 6 periods needs to turn up. These conditions are present on the current timeframe. Since the timeframe is monthly, the signal will not be confirmed until the close of July which is next Thursday. At this time we expect the signals will be confirmed.
For free 30 day trail, just send email address tim@ord-oracle.com.
Tim Ord,
Editor
www.ord-oracle.com