
Monitoring purposes SPX: Neutral
Monitoring purposes GOLD: Gold ETF GLD long at 173.59 on 9/21/11
Long Term Trend monitor purposes: Flat
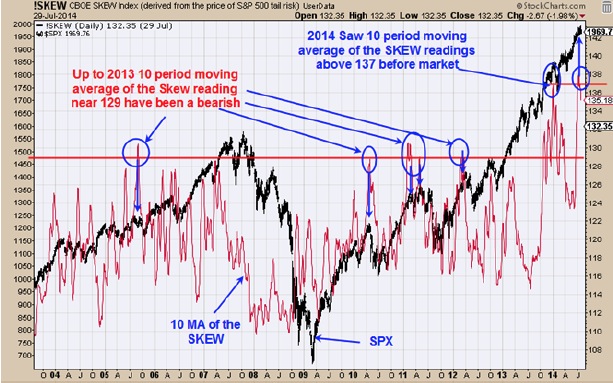
Above is the 10 period moving averge of the SKEW overlade on the SPX. When the SKEW get this high, it suggests a step up in volatility is just around the corner. Warning for a pull back in the SPX before 2014 is when the 10 period moving average of the SKEW traded above 129. After 2014, the January top in the SPX corresponded with a 10 period MA of SKEW at 137. In early and mid July the 10 period moving average of the SKEW reached 138. The SKEW is suggesting there is little upside for the market from current levels. Our stance on the market is still neutral.
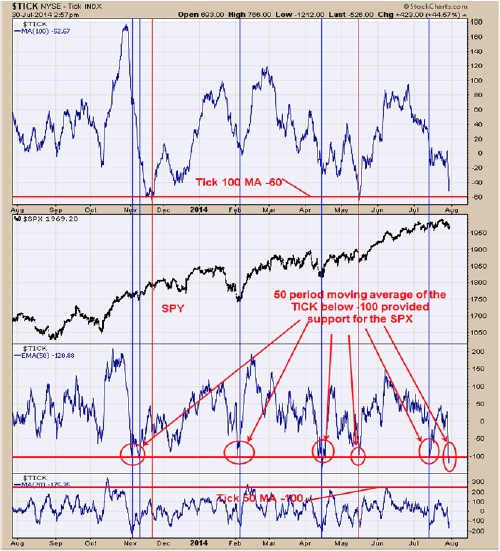
The second window up from the bottom is the 50 period moving average of the Tick. Support for the market has occurred when the 50 period moving average of the tick reached below -100 and today’s reading came in at minus 120.88. The top window is the 100 period moving average of the Tick and readings near -60 has supported the market and the current reading is -52.47 and not far off. The ticks readings are showing support for the market short term and suggests there is little downside from current levels. Yesterday’s closing Tick of -949 also suggest little downside from current levels. We have done studies with the Tick and Trin closings and yesterday’s reading of Tick close of -949 with a TRIN close of 1.34, which came a close match to 2/22/11 with a reading of minus 693 for the Tick and 1.38 for the Trin. The 2/22/11 started a long trading range that when into the August to October double bottom for 2011. The chart on page one suggests there is little upside and Tick chart suggests little downside which matches the definition of a trading range.
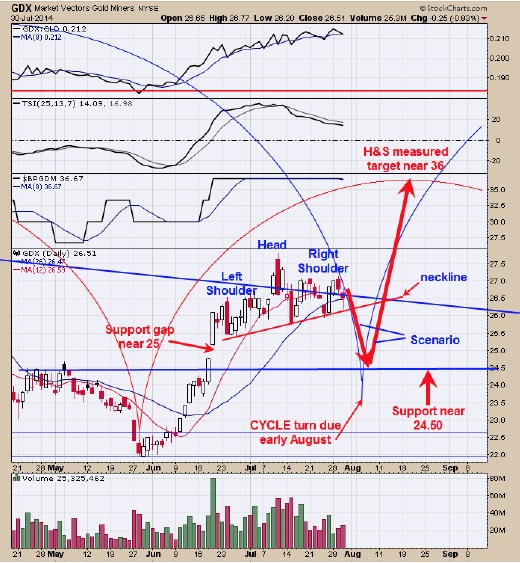
We are keeping a close eye on the shorter term timeframe for GDX. The blue semi circle is the Cycle Took which shows a target turn in early August. The pattern that appears to be forming in GDX since late June is a Head and Shoulders top pattern where the July 10 high is the Head. This potential Head and Shoulders pattern has a measured target to 24.50. The 24.50 range is near where a Gap formed (which is a support area) and also where the late April and May highs are and is also a support area. We have pointed out in the past that most large gaps get filled at some point and the gap near 25 will get filled most likely sooner then later. The FOMC meeting is yesterday and today and Employment numbers come out Friday and therefore could see volatility expand this week. Ideally we would like to see a bullish setup on GDX to occur near the 24.50 range on the GDX and something we will be watching for.
For free 30 day trial to the Ord Oracle report just drops us your email to tim@ord-oracle.com.
Tim Ord
Editor
www.ord-oracle.com