
Trim Tab’s Charles Biderman made an exceptionally sage observation recently noting the ratio between wages and salaries and total stock market cap. In this Squawk Box interview, Biderman said, "If you look at the relationship between wages and salaries and the market cap, it's like 3.5 times. The last two times it was close to this was in March of 2000 and October 2007." Those were both momentous peaks. This is another logical measure that strongly implies gross overvaluation but it is clearly not a measure that can be utilized for timing.
We hasten to remind readers that the first quarter was the second largest in history for corporate stock buybacks and that the biggest quarter was the third quarter of 2007, the exact peak of the previous bubble. Too many strategists have hinged their forecasts on rising corporate earnings but much of the improvement has been based on the financial engineering of buybacks that say zero about improving fundamentals. This type of earnings growth is an illusion.
The principal drivers of buybacks, leverage, increased exposures and HFT have endured for five-and-a-half years and are all at levels consistent with a major peak. Under the circumstances, we are left with only one pertinent analysis. This is a stock market bubble. The bubble builds, the bubble builds some more and eventually it bursts. There is no way to be bullish in this environment. We expect at least a 25% decline.
How Did We Get Here?
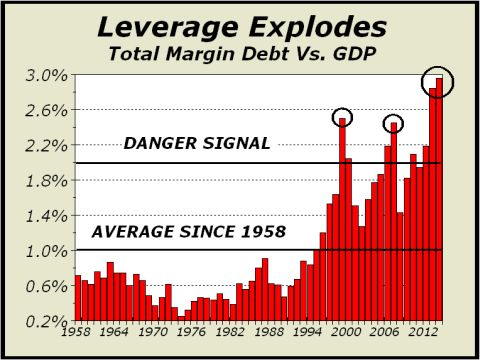
Total margin debt, which includes both the NYSE plus NASD, fell by a mere 0.7% in July ($3.6 billion), a statistically insignificant amount. The total is nevertheless the third highest monthly total ever and versus gross domestic product, total leverage remains at a fantastic extreme (see chart below left). None of the speculation or valuation methods anyone utilizes can ever pinpoint a major peak in stock prices but this measure reveals risk is exceptionally high, the highest it has ever been with the single exception of the very top in prices in 1929.
We’ve mentioned mindsets and another of the concepts that needs to be re-examined is the old adage of the little investor, that they are never right. Only the pros are right. Thus, we were amused to see a recent article (see http://bit.ly/1rqxS9I) that included the chart at bottom right, judging “Retail Investors Totally Wrong… Again!” Seems to us the chart is solid evidence that this small sample from AAII has copied exactly what the pros have done in our front page chart, buying all the way up and increasing exposure to the maximum right at or very near the previous major market peaks and then selling stock all the way down and reaching minimum exposure at pretty much the exact bottom. Both groups behave the exact same way. It is a perfect example of human nature.
The important takeaway is that major turning points for stocks have been achieved at the extremes, both for cash positions and for leverage such as shown in both charts. The last time the AAII sample shown here was at this very same level was very close to the 2000 top! This should tell us all we need to know. The evidence provided by both charts is a clarion call that a major stock market peak is close at hand.
But wait, there’s more! We have shown the HFT cycle chart at center twice before in our pages to explain the obvious mystery of valuation extremes similar to huge peaks in the past. The last time was a year ago and the subject deserves another brief look. Simply put, most of the money churning in today’s market has no concept of valuation and couldn’t care less. In 2009, high frequency trading (HFT) was thought to constitute as much as 73% of all stock volume. Estimates are now as low as 50%, but that is still a Lion’s share. The relevant time frame for some HFT traders could be hours, minutes, or even seconds. Positions are not held long enough for valuations to matter. Each HFT methodology reinforces the other and the divorce from valuations has likely been a factor in the one way street we see today. There is convincing evidence that HFT has rigged the market (see http://bit.ly/YVvAmn).
Another significant contributing factor driving the bull market has been the decision by many corporate managements to repurchase shares. In just the first three months of 2014, buybacks totaled $637 billion at an annual rate, which nearly matches the previous record high when stocks peaked in 2007. For the sake of comparison, from the bottom in 2002 to the peak in 2007, net inflows for mutual funds was only $548 billion. Corporate repurchases in one quarter were more than all inflows for mutual funds for the entirety of the previous bubble! Thus we have yet another signal of excess matching a previous stock bubble. From the first quarter of 2009 through the first quarter of 2014, S&P 500 companies have repurchased $1.9 trillion of their own shares. These “strategies” have increased earnings per share, giving companies the appearance of a better looking valuation that has nothing to do with an actual improvement in their business. And of course, executives are richly rewarded with compensation in stock, so the strategy suits them fine. However, at present prices, investing in shares rather than the business is wildly irrational. We’re not going to participate in this madness. It can’t last.
Alan M. Newman, Editor, Crosscurrents
www.cross-currents.net