
There are several ways that data can be managed by an indicator formula. The two most common used for stock indicators are the cumulative formula and the standard moving average. The standard moving average drops off the last data and adds the current new data for the period setting, usually a day of data for short term trading. Cumulative indicator formulas accumulate data, do not drop off data over time, and consequently the values of the indicator change over time altering the original patterns in a minor but sometimes obvious way. For example the Detrending Price Oscillator DPO indicator can appear to lag price as time moves forward because it is a cumulative indicator.
Cumulative indicators are not as common as the ordinary moving average which drops off price and time as it moves forward each day, week, etc. This makes moving averages prone to occasional severe shifts in the line if a huge price action occurs on the current day OR on the last day that was dropped off as the moving average does each day.
For many technical traders this shift is not noticed. However in studying cycles or other extended patterns, the moving average that drops off price each day can significantly alter the way the moving average line is presented on the chart.
The same is true of Bollinger Bands® when an extreme sudden huge price action occurs, and the bands shift often dramatically to accommodate the change in the huge price action.
Therefore, it is important as a technical trader to know whether the indicator chosen is a standard moving average that drops off price each day as the new price for the day is added, or if the indicator is a cumulative indicator that adds additional price and time data and does not remove any prior data.
Understanding how moving averages and cumulative indicator lines function due to the distinctly different approaches to managing data used in the formula, is critical to successful technical trading. When a cumulative indicator is used, the current line indicator will tend to lead. Some cumulative indicators that use Price, Quantity aka Volume, and Time in the formulation lead significantly when compared to a moving average indicator.
This may not seem significant but when using these indicators for precise confirmation of entries or exits, it can change the interpretation in many ways.
One of the most useful features of Volume and all the variations of Volume indicators, is the fact that most of them use cumulative formulations which helps maintain the proper relationship between Price and Volume. Many Price indicators use the standard moving average that drops off data as it adds data.
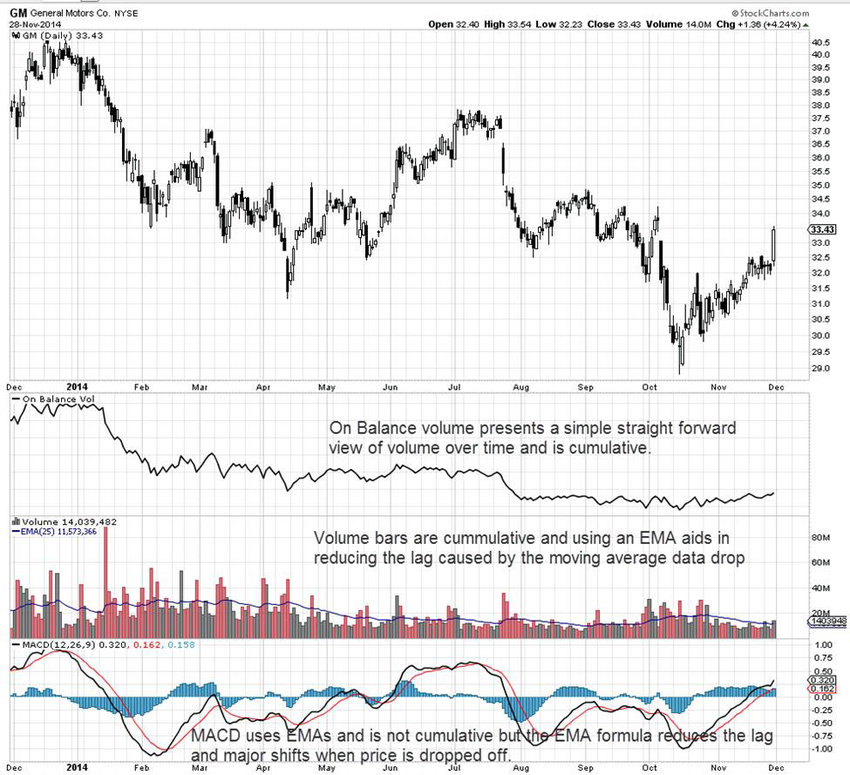
The General Motors Co. (NYSE:GM) chart below shows On Balance Volume which is cumulative, and Volume bars with an Exponential Moving Average EMA. Volume bars are cumulative as presented. The EMA with its unique calculation method although not cumulative, calculates the current and most recent prior data with the most emphasis providing a compromise between the cumulative and the standard moving average. The MACD indicator uses two Exponential Moving Averages EMA, which help to mitigate some of the major shifts that would occur with simple moving averages. Most Stochastic formulas are simple moving averages which drop off data.
Summary:
It is important to understand whether the indicators you are using drop off data or cumulate data as both lines do shift over time but in entirely different ways. When data is dropped off that is much larger than the average, this can cause a shift for the current data and indicator.
Cumulative indicators tend to have the line shift back in time so that analysis of prior periods is less accurate. Often times what was a leading indication of Price or Volume action, slowly begins to appear to be lagging when viewed many months or years in the past.
Trade Wisely,
Martha Stokes CMT
www.TechniTrader.com
info@technitrader.com