
Monitoring purposes SPX; Flat.
Monitoring purposes GOLD: Gold ETF GLD long at 173.59 on 9/21/11
Long Term Trend monitor purposes: Flat
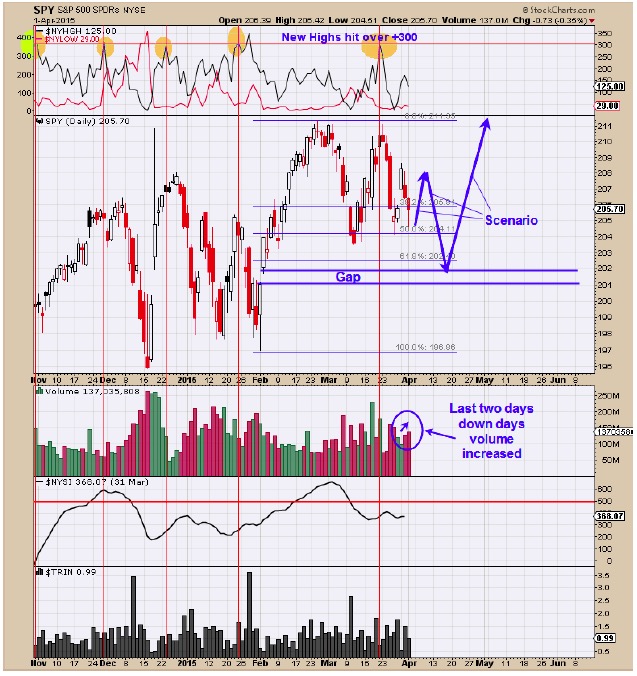
Here is our take over the next several days. Tomorrow is the day before Good Friday and according to history has an73% chance of being an up day. There is an open gap for February 3 near 201.50 to most likely will get filled before the market heads much higher and our target for the next low. The last two days down saw the volume increase and a short term bearish sign. Therefore if the potential bounce tomorrow is on light volume than today’s decline, than that will show weakens on the rally and would anticipate another decline that could take a shoot at the February 3 gap. If the February 3 gap gets tested and the VIX jumps > 20 (see page two) than the condition would be ripe for the next advance.
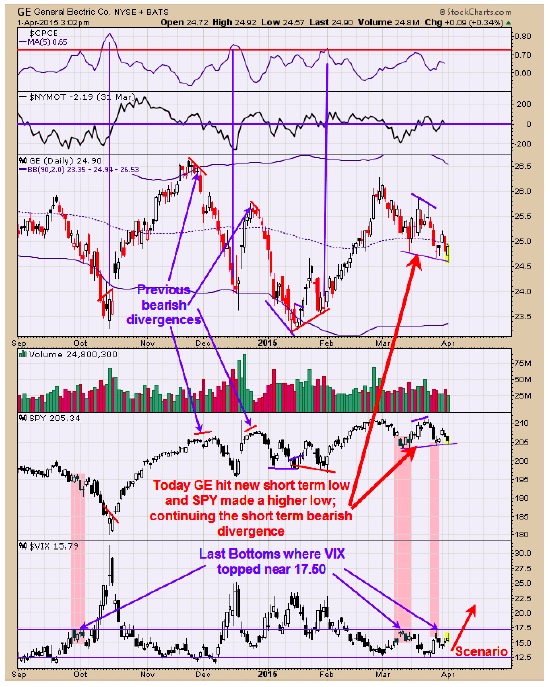
The bottom window in the chart above is the VIX which is a fear gauge. The March 11 low formed with the VIX near the 17.50 level. The last time the VIX was this low came at a minor low formed back in early October. In Early October the SPY did bounce short term, than headed lower into the mid October bottom and where the VIX jumped over 30. At the March 11 low the VIX jumped again to 17.50 and SPY rallied a week and than another retracement back down to last Thursday low and again the VIX bumped to 17.50 range. To get things cooking on the upside it would require a panic reading in the VIX to reach higher than 17.50 and preferably >20. It is said, “Where GE goes so goes the market”. On the chart above we have pointed out the previous divergences between GE and SPY. Notice that the last high in the SPY made a higher high and GE made a lower high and a bearish divergence for the SPY of which the SPY pulled back. Today GE made a lower low where SPY made a higher low and another negative divergence for the SPY suggesting at some point SPY will break to a new recent low. Tomorrow is the day before Good Friday holiday and usually an up day and market may bounce. On this potential bounce we may look for a sell signal with a downside target February 3 gap level near 201.50 and if that target is met and the VIX reaches in the low 20’s a buy signal could be triggered at that level.
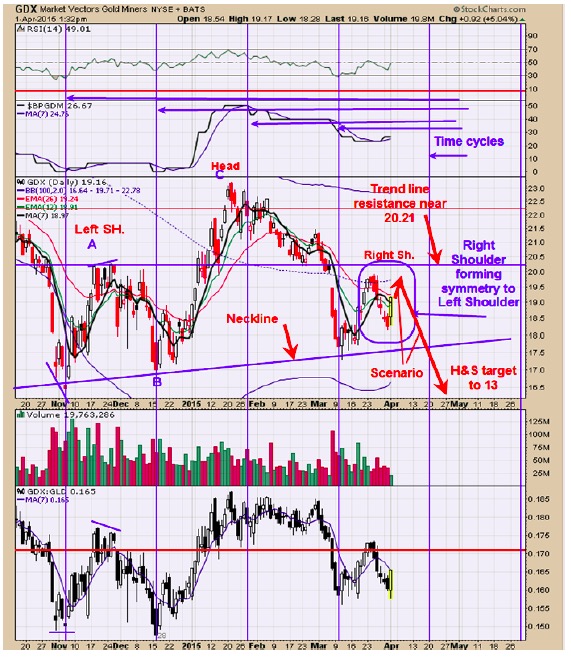
A Head and Shoulders top pattern appears be forming were the Head is the late January high. The Right Shoulder is forming now and is becoming symmetric both in time and form which normally lead to the success of the pattern. This potential Head and Shoulders pattern has measured target near 13. There are cycle vertical lines on the chart that represent Cycle lines and the next cycle line is due April 20 which could represent the breaking of the Neckline. There is a minor cycle high due April 6 which is Monday and could mark the high of the Right shoulder. We could end up with a sell signal later this week or early next week possible in the 19.50 to 20.50 region on GDX. Will be patience for now. A major bottom could form later this summer in the July to August time frame.
For examples in how "Ord-Volume" works, visit www.ord-oracle.com.
Tim Ord
Editor