
Monitoring purposes SPX: long SPX on 8/21/15 at 1970.89.
Monitoring purposes GOLD: Flat
Long Term Trend monitor purposes: Flat
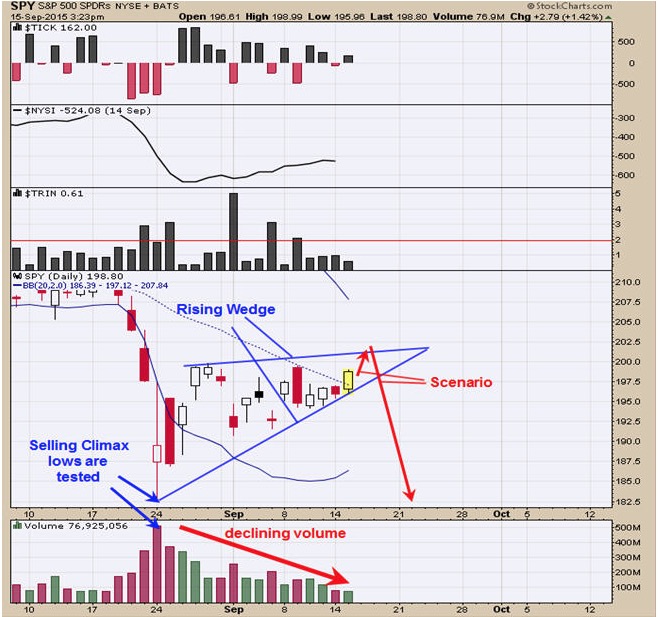
The pattern forming appears to be a bearish “Rising Wedge”. This pattern in general chops higher on decreasing volume and it matches what is going on in the SPY. The today’s rally may continue into the FOMC meeting announcement which comes this Thursday. Also this is option expiration week which has a bullish bias. Of all the weeks of the year this week is the strongest and has a 90% change of ending positive and has an average gain for the week of 1.74%. If this pattern is a “Rising Wedge” than it will have a downside target to where the pattern began which is the August 24 low near 182.50 on the SPY. long SPX on 8/21/15 at 1970.89.
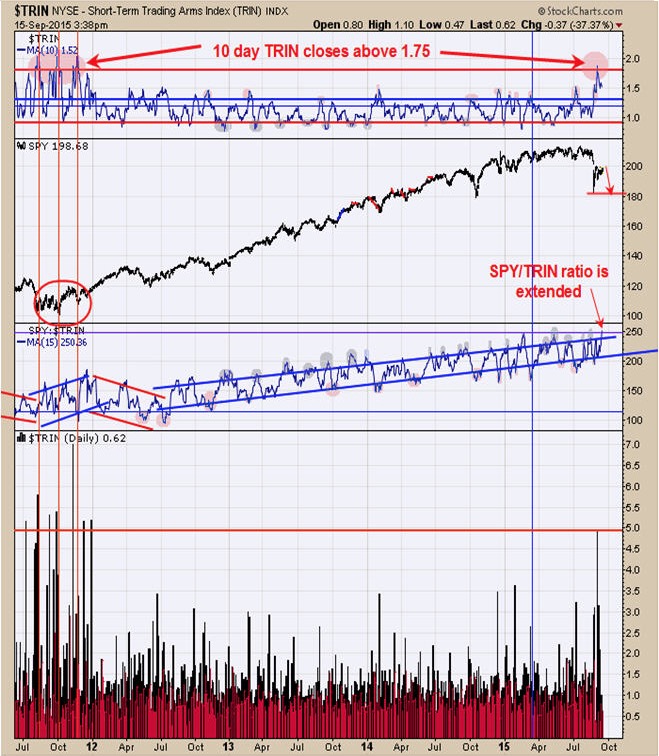
The top window in the chart above is the 10 day average of the TRIN. On the recent decline the 10 day TRIN reached 1.87 for the high. Previous times this indicator reached this high, the market was in a basing period (see late 2011 period). To say this time will be a basing period also will be determined by the next decline in the market and what the 10 day average of the TRIN will reach. If the 10 day TRIN reaches above 1.75 on the next decline than a basing period is the probable outcome. On the next decline the 10 day average reaches, say 1.50 or less than the decline may continue. We have said before market bottoms form on panic and the higher the panic the stronger the bottom. We determine bottoms with the TRIN and Tick indicators. We said on page one, that it appears a bearish “Rising Wedge” is forming and the “Rising Wedge” started at the “Selling Climax” low of August 24. Almost all “Selling Climaxes” lows are tested at some point. The middle window above is the SPY/TRIN ratio. Right now this SPY/TRIN ratio is above the top boundary line and is extended and suggests the current rally is extended and most likely will become more extended as market pushes higher. Market could push up into Friday but next week most likely will be a down week.
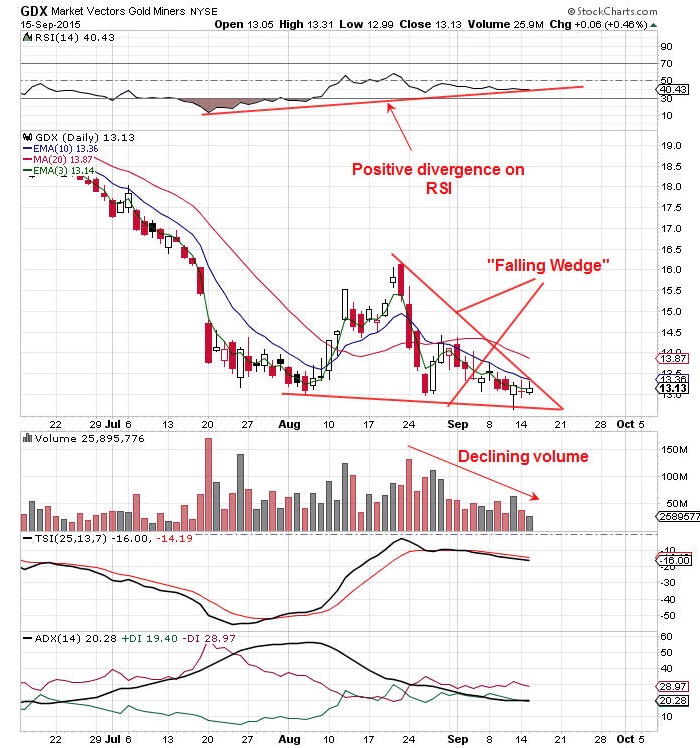
The COT (Commitment of Traders) report are back to neutral as the Small Speculator remains net short of last report dated 9/11/15 at -3314 contracts (which is bullish) and Commercials in neutral position with -55,979 contracts (below 50,000 contracts would be a bullish sign). Last Friday GDX broke to new lows and than closed above the previous lows creating a bullish “Shakeout”. The last two days trading has managed to hold above the lows and keeps the picture bullish for now. The pattern that may be forming is a “Bullish Falling Wedge”. This potential “Bullish Falling Wedge” has an upside target to where the pattern began and in this case would have a target near 16.00. The top window is the RSI and has been showing a bullish divergence. Picture is still incomplete and will need more evidence before a signal will be generated. Staying neutral for now.
Tim Ord
Editor
For examples in how "Ord-Volume" works, visit www.ord-oracle.com.
New Book release "The Secret Science of Price and Volume" by Timothy Ord, buy on www.Amazon.com.