
Monitoring purposes SPX: long SPX on 9/22/15 at 1942.74.
Monitoring purposes GOLD: Flat
Long Term Trend monitor purposes: Flat
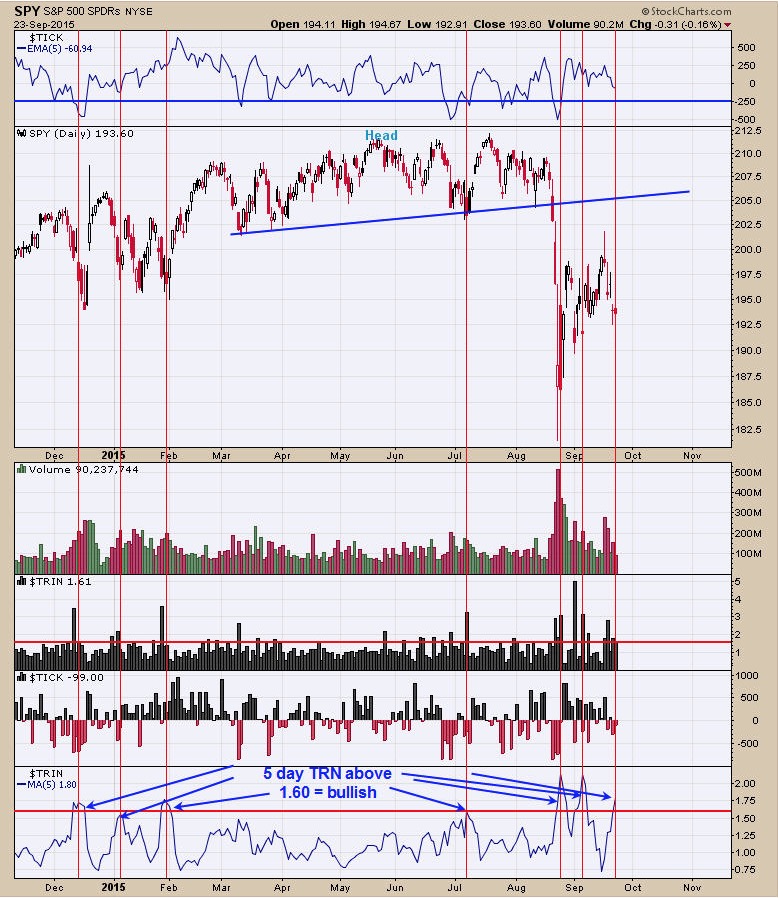
Today the 5 day average of the TRIN closed at 1.80. The bottom window in the chart above is the 5 day average of the TRIN going back 10 months. Each time the 5 day average of the TRIN reached above 1.60 the market was at or near a short term low. The top window is the 5 day average of the TICKS and readings below -250 have been a bullish sign short term for the market. The 5 day Ticks did not reach the bullish level which would have been nice for confirmation but the 5 day TRIN suggests a low is forming near current levels. Last Thursday’s high had high volume and most high volume highs are tested and our upside target for now. Long on 9/22/15 SPX at 1942.74.
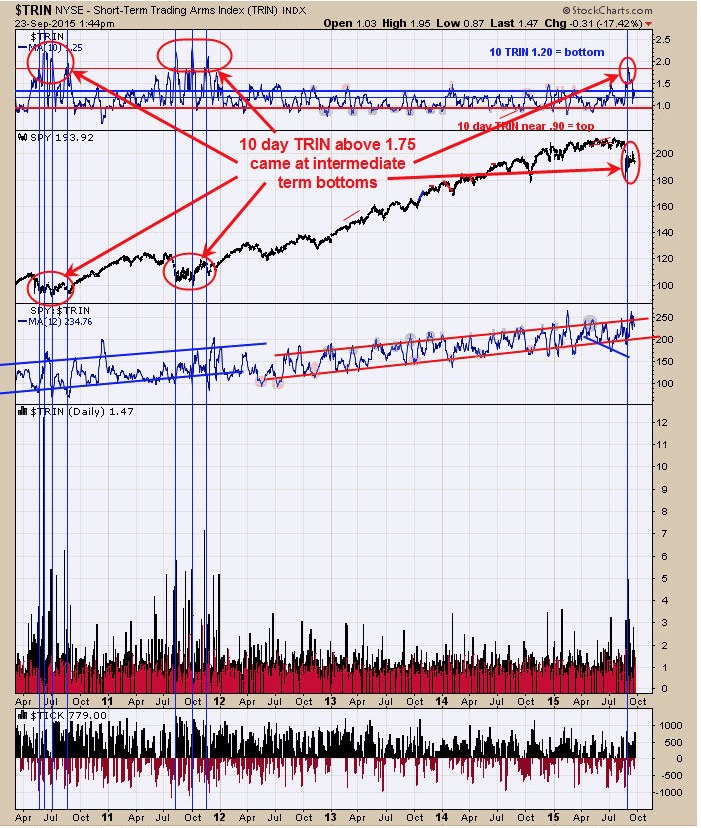
The chart above goes back to early 2010 and looks at the bigger picture. The top window is the 10 day average of the TRIN. The 10 day TRIN above 1.75 show extreme panic in the market and panic is what happens at bottoms. Both at the July, August 2010 and August, September 2011 lows show the 10 day TRIN reaching above 1.75 several times indicating the market was unable to push lower. On September 3 this year, the 10 day TRIN reached 1.87 suggesting the start of a basing building period has started for the market. The current potential bottoming process may take the 10 day TRIN above 1.75 a couple more times like it did at the 2010 and 2011 bottoms. The volatility may continue for the next couple of months. Long SPX on the close of 9/22/15 at 1942.74.
Free 30 day trial, just respond to tim@ord-oracle.com.
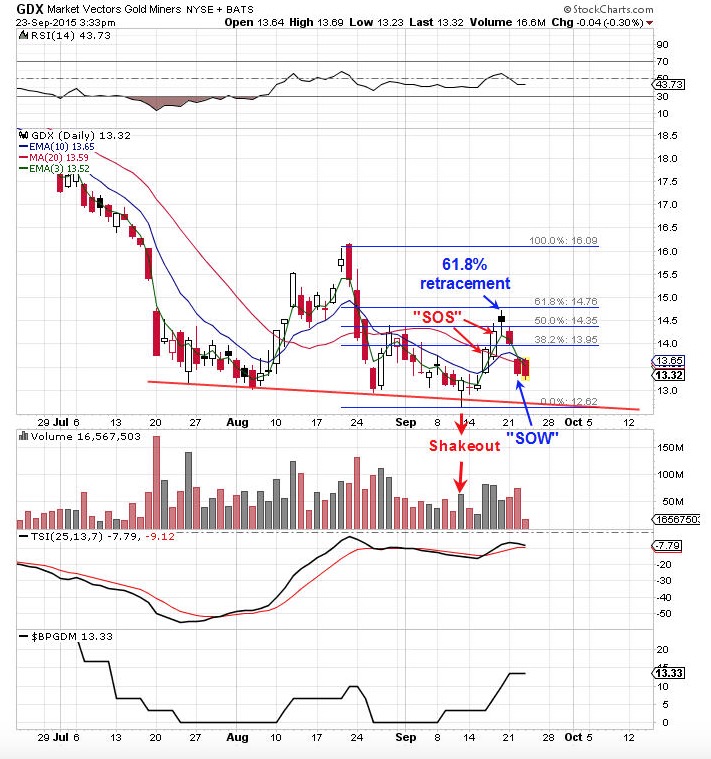
The COT (Commitment of Traders) report are back to bullish as the Small Speculator remains net short of last report dated 9/18/15 at -6568 contracts (near double short from previous week and bullish) and Commercials are back to a bullish position with -32,979 contracts (below 50,000 contract is a bullish sign). The above chart is the daily GDX. It’s a mixed bag for the short term. A bullish “Shakeout” was performed on the break to a new low on September 11 and than rallied back above the lows. The following rally showed two “Sign of Strength” days (SOS) and retraced 61.8% of the previous decline adding to the bullish picture. Yesterday’s decline saw a “Sign of Weakness” (SOW) (big volume and large price decline) and turned the picture back to neutral. Today’s pull back came on lighter volume and tested yesterday’s low on lighter volume suggesting the low yesterday has support. We still don’t see a safe short term trade here but the larger picture is looking bullish.
Tim Ord,
Editor
For examples in how "Ord-Volume" works, visit www.ord-oracle.com. New Book release "The Secret Science of Price and Volume" by Timothy Ord, buy on www.Amazon.com.