
SPX Monitoring Purposes; Long SPX on 5/19/21 at 4115.68.
Monitoring Purposes GOLD: Long GDX on 10/9/20 at 40.78.
Long Term SPX Monitor Purposes: Sold long SPX on 1/15/21 at 3768.25= gain 10.80%; Long SPX on 10/26/20 at 3400.97.
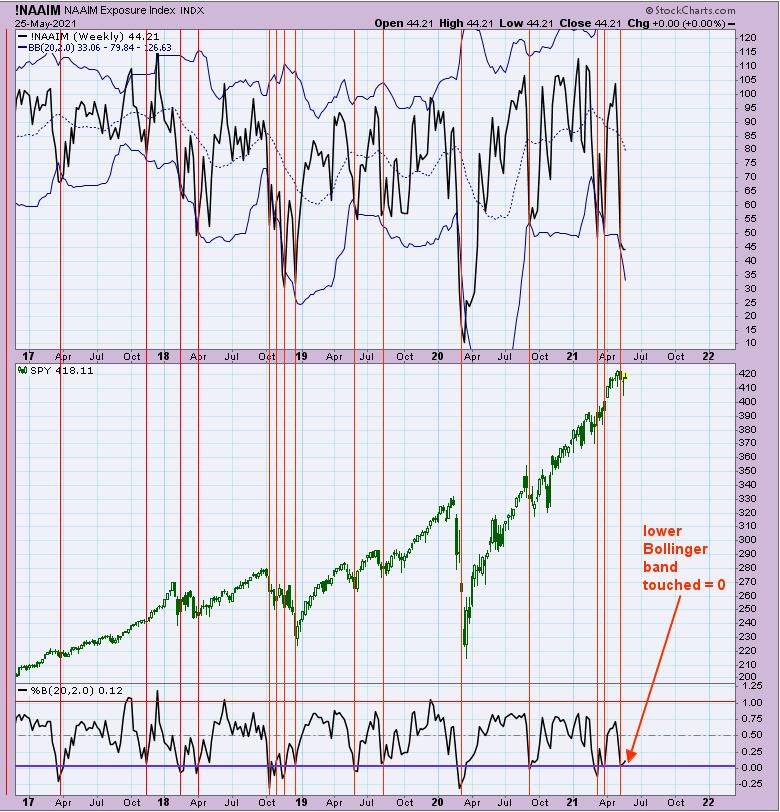
We showed this chart recently, now updated to today's close. The chart above is the weekly National Association of Active Investment Managers (NAAIM). The NAAIM Exposure Index represents the average exposure to US Equity markets reported by its members' current exposure index sets at 44.21% -- meaning the NAAIM have 44.21% of their assets in the market, which is pretty low. In the past, that has been a bullish level. We also look at the Bollinger Bands on the NAAIM and, when this index falls and hits its lower Bollinger Band, the market has been near a low. The bottom window is the Percent Bollinger Band; when "0" is reached, that means the lower Bollinger Band is touched (which was hit recently). Long SPX on 5/19/21 at 4115.68.

The bottom window in the chart above is the 3-day average of the VVIX/VIX ratio. This chart goes back to 2018. What the 3-day average of the VVIX/VIX ratio helps to identify is short-term tops in the SPY. We pointed out examples on the chart above where the ratio was making lower highs while the SPY was making higher highs several weeks ahead of the actual high in the SPY. Zooming in on the window to the right of the chart is the current time frames, which show the current condition of the market. Notice that the VVIX/VIX ratio has made short-term higher highs as the SPY has made short-term higher highs, which is a bullish condition for the SPY. So far, no short term negative divergences has showed up for the SPY.

We posted this chart in our report back in early April, which is the weekly GDX along with the GDX/GLD ratio. The dialog on the chart remained the same as posted in April. The rally that was projected back then turned out as expected. So far, the weekly GDX/GLD ratio is still making higher highs and higher lows, which is bullish intermediate term for GDX. Expect a new high in GDX in the coming weeks. Long GDX (10/9/20 at 40.78).
Tim Ord,
Editor
www.ord-oracle.com. New Book release "The Secret Science of Price and Volume" by Timothy Ord, buy at www.Amazon.com.