
SPX Monitoring Purposes: Sold Long 3/3/22 at 4363.49 =3.27% gain; Long SPX on 2/23/22 at 4225.50.
Monitoring Purposes GOLD: Long GDX on 10/9/20 at 40.78.
Long Term SPX Monitor Purposes: Neutral.
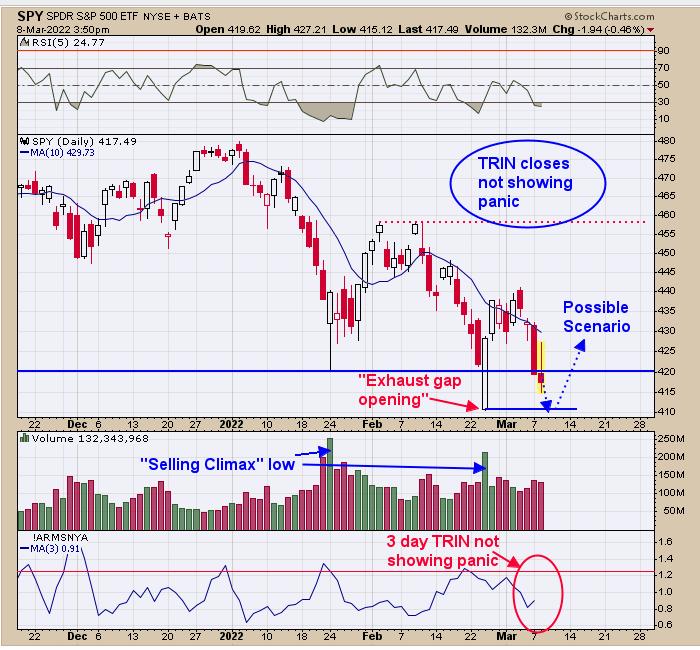
Not seeing panic in the VIX, TRIN or TICK closes on the current decline, suggesting no worthwhile low is forming here. It looks as though SPY may be trying for the February 24 "exhaustion gap" low, which is near 410 SPY. The bottom window is the 3-day TRIN, which closed Monday at .91; it needs to be near 1.30 range for a bullish reading. Sold Long 3/3/22 at 4363.49 =3.27% gain.

Panic forms at bottoms in market; no panic, no bottom. We use the TRIN as one of our panic-reading indicators. A TRIN close above 1.30 suggests there is panic in the market. The bottom window is the 3-day TRIN, which has a reading above .91. A 3-day TRIN close of 1.30 is considered bullish. The next window up is the 2-day TRIN, which closed at .78. A 2-day trin of 1.40 is bullish. The next window up is the 5-day TRIN, which closed at .93; readings above 1.20 are considered bullish. The top window is the 10-day TRIN, which looks at the bigger picture for the market. Readings for the 10-day TRIN above 1.20 is considered bullish; the current reading is 1.02. Averages of the TRIN closes at the moment are not set up in a bullish fashion, suggesting the market has not reached a worthwhile low.

We updated this chart from yesterday, where we said "on a previous report, we reported on the head-and-shoulders pattern that developed from the August 2020 high to the February 2022 breaking of the neckline on gold. That head-and-shoulders pattern was the right shoulder of a bigger head-and-shoulders pictured above. We did have a 'Sign of Strength' (SOS) through the neckline of the smaller head-and-shoulders pattern in February. Gold is now heading to the larger neckline of the bigger head-and-shoulder pattern that dates back to 2011. A breaking of this larger neckline should also produce a 'SOS' and probably a much larger SOS. The point is that the acceleration in gold may increase as gold approaches the larger neckline. The monthly chart looks good and the monthly rules the weekly which rules the daily charts." The larger neckline lies near 2050 on gold and where its likely an acceleration may occur, as is where an "SOS" is needed to confirm the breakout of the larger neckline.
Tim Ord,
Editor
www.ord-oracle.com. New Book release "The Secret Science of Price and Volume" by Timothy Ord, buy at www.Amazon.com.