
SPX Monitoring Purposes: Long SPX on 3/25/22 at 4543.06.
Monitoring Purposes GOLD: Long GDX on 10/9/20 at 40.78.
Long-Term SPX Monitor Purposes: Neutral.
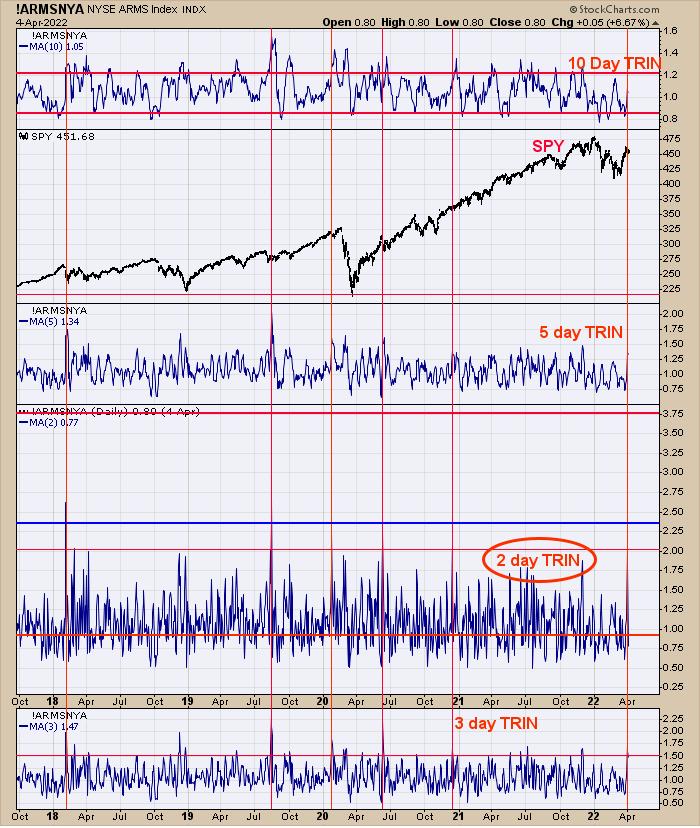
Next week is options expiration week and, during the week before (a.k.a. this week), whipsaws are common. Indeed, the "Whipsaw" may be in progress now. Last Thursday, we had a 2-day TRIN that averaged 2.02. Turn your attention to the second window up from the bottom, which is the 2-day TRIN. Two-day averages of 2.00 and higher (noted with red vertical lines) all have produced bottom that went on to make new short term highs. There can be tests of the 2-day TRIN lows and back-and-filling, but market reversals back to the upside is the norm. This time could be different, but April should be an up month. Today, the TICK closed at -604; usually, the next day is up when TICK closes below -300.
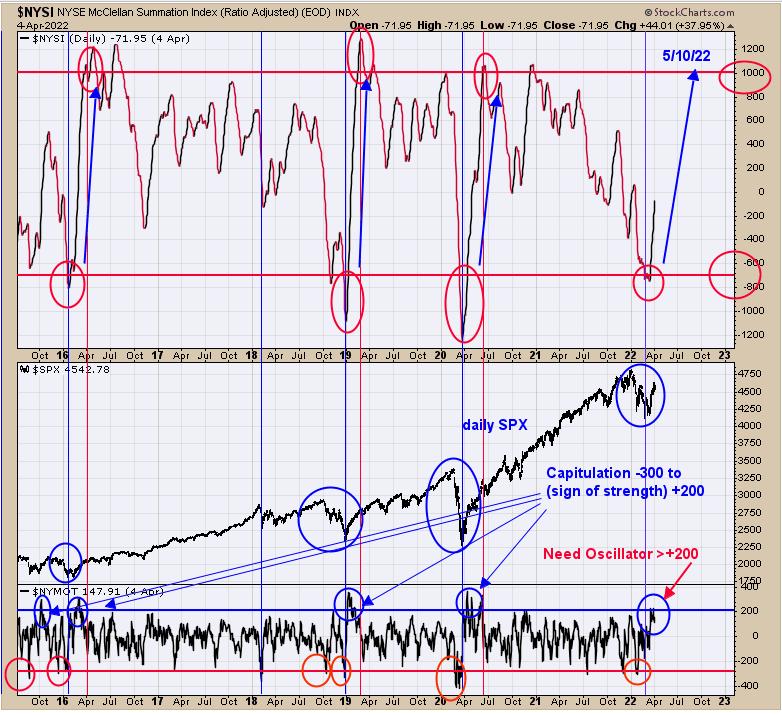
We updated this chart, which was posted in a recent report. The top window is the NYSE McClellan Summation index. Climatic bottoms occur when the Summation index falls below -700, which a fairly rare occurrence and happened only three times going back to 2016. When an oversold condition below -700 occurs, a rebound is expected, which normally takes the Summation back to above +1000, usually taking around two months. If the current situation plays out like in the past (gong back to 2016), then the Summation index may reach +1000 around May 10. We did have a "Sign of Strength" in the NYSE McClellan Oscillator, which traveled from -300 (climatic) to +200 (sign of strength) on the recent bottom. We pointed out the previous times that happened when the Summation index fell below -700. The market appears to have enough strength to push higher into May.
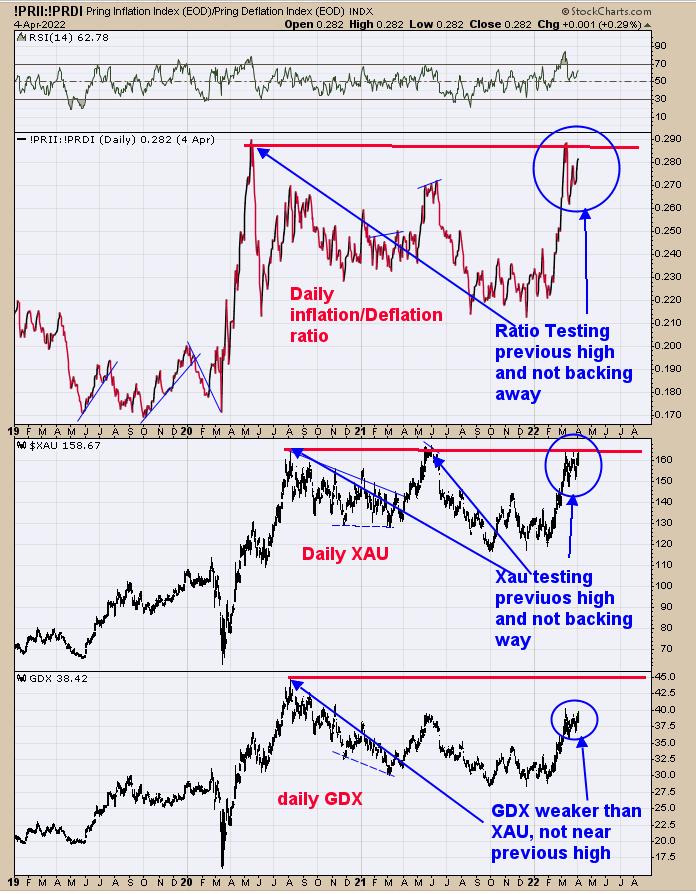
The second window down from the top is the Inflation/Deflation ratio. When this ratio is rising, it's a bullish sign for gold and gold stocks; when declining, it is a bearish sign. Right now, this ratio is testing May 2020 and not backing away from that high, suggesting this ratio is "eating through" supply and, once supply is exhausted, should move higher, taking gold and gold stocks with it. The next window down is the XAU (which is home to more of the high-tier major gold stock) and it, too, is at its previous high and not backing away, building "Cause" (energy) to push through resistance. Notice that GDX is not at its previous high (which is home to lesser-tier stocks), showing that the higher-tier stocks are leading the way higher. This happens early in the bull phase of the rally. When the lesser-tier stocks are leading the way (meaning speculation), its getting late in the bull phase. The sideways consolidation in GDX and XAU has been going on for nearly a month; time is about up for the consolidation to end and the Impulse wave to start. A clue that the impulse wave has started will be when the ratio breaks to new highs.
Tim Ord,
Editor
www.ord-oracle.com. New Book release "The Secret Science of Price and Volume" by Timothy Ord, buy at www.Amazon.com.
Signals are provided as general information only and are not investment recommendations. You are responsible for your own investment decisions. Past performance does not guarantee future performance. Opinions are based on historical research and data believed reliable, there is no guarantee results will be profitable. Not responsible for errors or omissions. I may invest in the vehicles mentioned above.