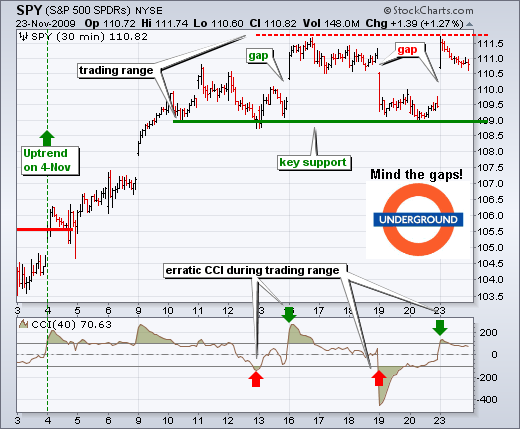
With another gap-surge on Monday, SPY has gapped up the last four Mondays (November 4, 9, 16 and 23). The first three gaps were part of an uptrend, but the fourth occurred within a trading range. Also notice that SPY gapped up-down-up over the last six trading days. Talk about a confused market. Furthermore, notice that SPY has been range bound with support at 109 and resistance at 111.8. SPY hit the top of the trading range with yesterday's opening surge.
Even though resistance is nigh, the gap and surge off support keep the uptrend alive. First, the advance prior to the trading range provides a bullish bias. Second, the medium-term trend is up. Third, SPY continues to hold support. A move below 109 would fill the gap, break key support and reverse this short-term uptrend.

CCI moved above +100 twice and below -100 twice over the last seven days. Four extreme moves in such a short period confirms the trading range on the price chart. Momentum favors the bulls when CCI moves above +100 and then holds above -100. Momentum favors the bears when CCI moves below -100 and then holds below +100. Seesawing above +100 and below -100 reflects erratic trading or a range bound market. Neither the bulls nor the bears can maintain an edge. Perhaps it is time to take a break from trading and enjoy a long Thanksgiving weekend. The "underground" symbol on the chart comes from the London Tube (subway). With gaps between the train and the platform, there are often announcements and signs saying "mind the gap".

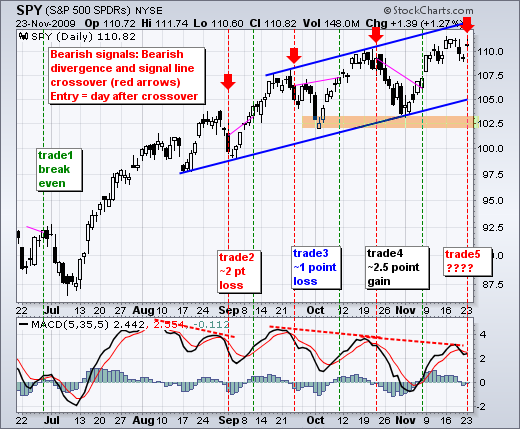
The chart above shows SPY with MACD(5,35,5) and the fifth bearish signal since June. A bearish signal occurs when MACD(5,35,5) formed a bearish divergence and moves below its signal line. The signal line crossover occurred with Friday's close, which puts the trade on Monday morning. Even though a better entry was obtained with Monday's big gap, this signal is already getting a challenge with such a strong move. A close above 111.5 would negate this signal.

CCI moved above +100 twice and below -100 twice over the last seven days. Four extreme moves in such a short period confirms the trading range on the price chart. Momentum favors the bulls when CCI moves above +100 and then holds above -100. Momentum favors the bears when CCI moves below -100 and then holds below +100. Seesawing above +100 and below -100 reflects erratic trading or a range bound market. Neither the bulls nor the bears can maintain an edge. Perhaps it is time to take a break from trading and enjoy a long Thanksgiving weekend. The "underground" symbol on the chart comes from the London Tube (subway). With gaps between the train and the platform, there are often announcements and signs saying "mind the gap".

The chart above shows SPY with MACD(5,35,5) and the fifth bearish signal since June. A bearish signal occurs when MACD(5,35,5) formed a bearish divergence and moves below its signal line. The signal line crossover occurred with Friday's close, which puts the trade on Monday morning. Even though a better entry was obtained with Monday's big gap, this signal is already getting a challenge with such a strong move. A close above 111.5 would negate this signal.

About the author:
Arthur Hill, CMT, is the Chief Technical Strategist at TrendInvestorPro.com. Focusing predominantly on US equities and ETFs, his systematic approach of identifying trend, finding signals within the trend, and setting key price levels has made him an esteemed market technician. Arthur has written articles for numerous financial publications including Barrons and Stocks & Commodities Magazine. In addition to his Chartered Market Technician (CMT) designation, he holds an MBA from the Cass Business School at City University in London.
Learn More