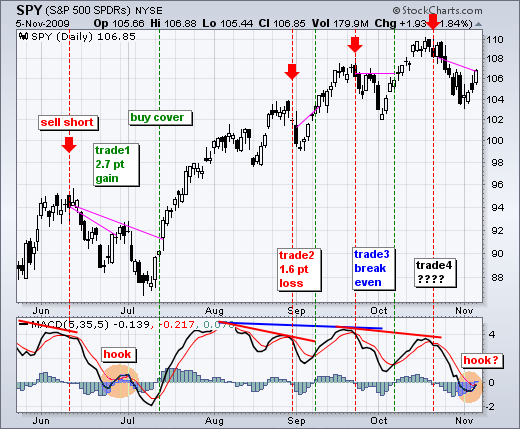
With a bounce over the last four days, MACD (5,35,5) crossed above its signal line on Thursday's close. Red dotted lines mark prior signals when MACD formed a bearish divergence AND crossed below its signal line. The last such signal occurred on October 21st. Green dotted lines show when MACD crossed back above its signal line. Even though this crossover could be used as an exit on short positions, a good portion of profits have been lost because SPY is already 3% above its reaction low. Traders need to pick profit points and exit before the signal line crossover to make this trading system robust.
Technically, the medium-term trend remains up as SPY held above its early October low. Therefore, this bounce has the bigger uptrend backing it up. I am, however, concerned that we could see a bear hook in MACD. This occurred in mid June when MACD moved above its signal line for a few days and then crossed back down. Again, too much ground would be lost if we wait for MACD to cross below its signal line. Therefore, I would turn to the 30-minute chart to identify a bearish trend reversal.
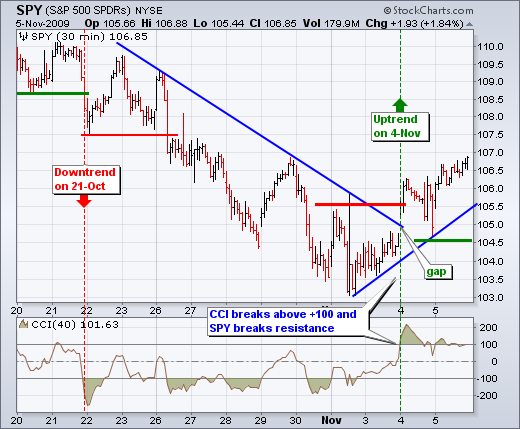
SPY remains in a short-term uptrend on the 30-minute chart. The ETF broke resistance at 105.5 on Wednesday morning and again on Thursday morning. More importantly, the support zone around 104.5-105 held. Also notice that CCI moved above +100. At this point, the short-term trend is up until proven otherwise. How long and how far it carries is anyone's guess. We can, however, identify the criteria for reversing this uptrend. A break below key support at 104.5 and a CCI move below -100 would to the trick.


