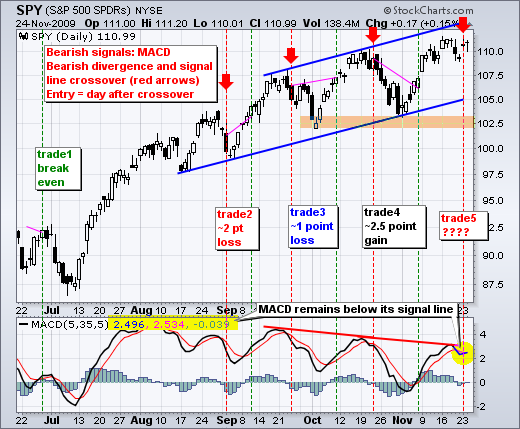
I am showing three charts for the S&P 500 ETF (SPY) today. The first shows daily candlesticks with MACD(5,35,5). SPY is trending up with higher highs and higher lows, but MACD(5,35,5) is trending down with lower highs and lower lows. Even though the downtrend in MACD reflects less upside momentum, MACD is above zero and this means upside momentum is still stronger than downside momentum. Put another way, positive MACD(5,35,5) means the 5-day EMA is above the 35-day EMA. With lower highs in MACD and higher highs in SPY, bearish divergences formed over the last few months. MACD moved below its signal line on Friday and remains below its signal line as of Tuesday's close. A move back above the signal line would negate this bearish MACD signal.

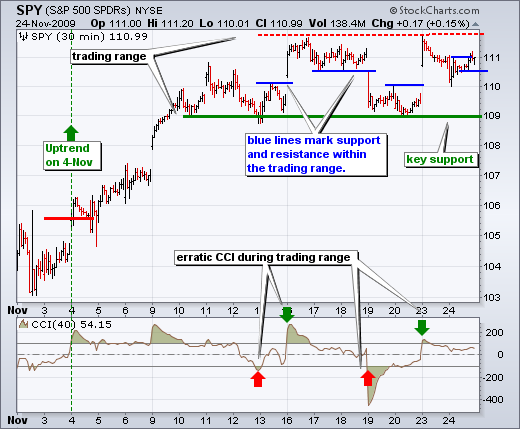
On the 30-minute chart, SPY advanced from November 2nd until November 16th and then moved into a trading range. SPY hit resistance around 111.8 twice in the last seven days. Overall, this looks like a consolidation after an advance, which is more bullish than bearish. Monday's gap up is also holding and key support remains at 109. A break below this level would fill the gap and fully reverse the short-term uptrend. The blue lines show support and resistance levels within the trading range. Traders able to watch the market intraday can catch early signals. The first three breaks occurred with gaps that would have been difficult to catch. The most recent signals are detailed below.

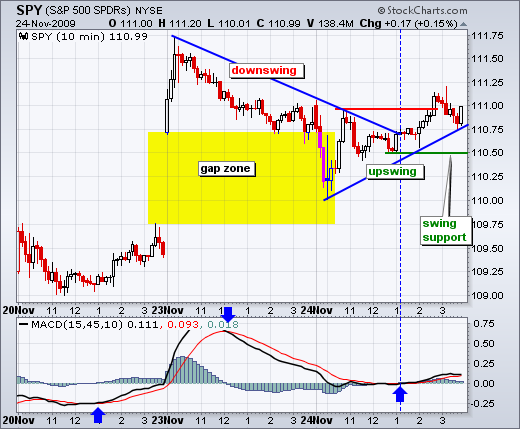
The third chart shows 10-minute candlesticks with MACD(15,45,10). After a downswing to around 110, SPY reversed course with a break above 111 late Tuesday. The bulls have a clear edge as long as upswing support holds and MACD remains above its signal line. I am marking upswing support at 110.5. Keep in mind that this is for the upswing within the trading range on the 30-minute chart. A move below 110.5 would reverse this upswing and target a move towards support around 109.

