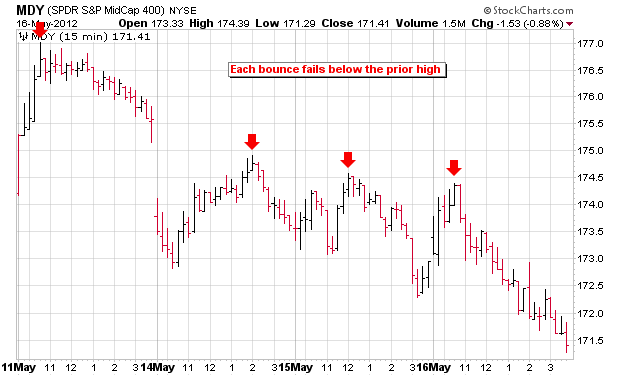
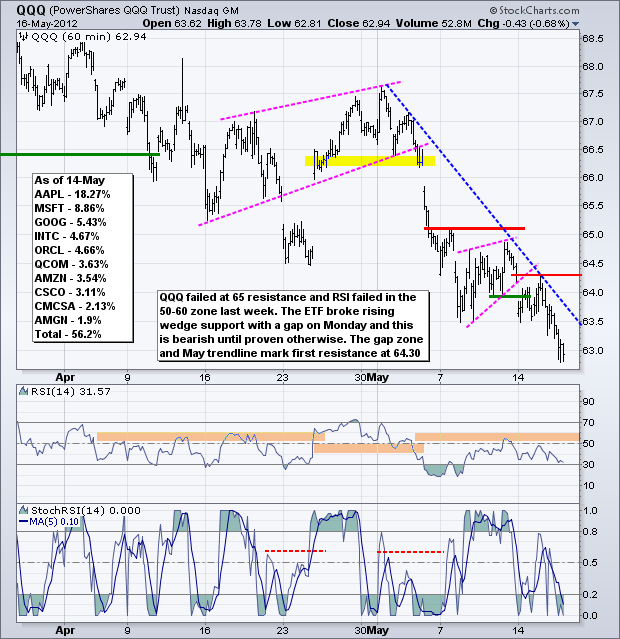
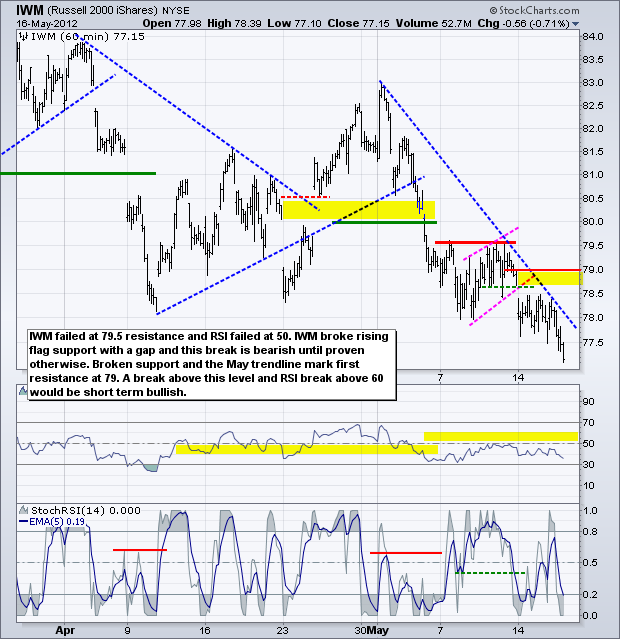
There it is again. Stocks opened with a little bounce and then worked their way lower the rest of the day. Every intraday bounce since May 11th has led to renewed selling pressure and lower lows. Buying pressure is weak on the bounce and none-existent after the bounce. The major index ETFs closed lower on Wednesday with small-caps and mid-caps leading the way. Six of the nine sectors were lower with finance, materials and technology leading the way down. The three defensive sectors, utilities, healthcare and consumer staples, closed slightly higher.
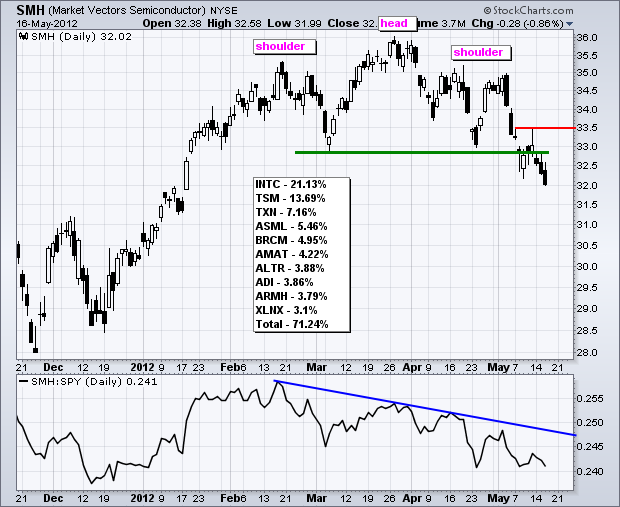
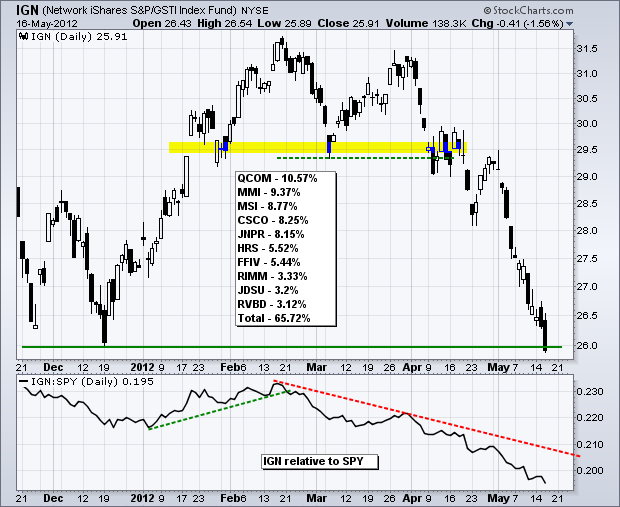
The Market Vectors Semiconductor ETF (SMH) and the Networking iShares (IGN) were especially hard hit on Wednesday. Led by weakness in Applied Materials (AMAT) and Intel (INTC), SMH broke neckline support of a head-and-shoulders reversal. A strong surge above 33.5 is needed to negate this and turn it into a bear trap. IGN broke below its December low and remains one of the weakest groups within the technology sector.
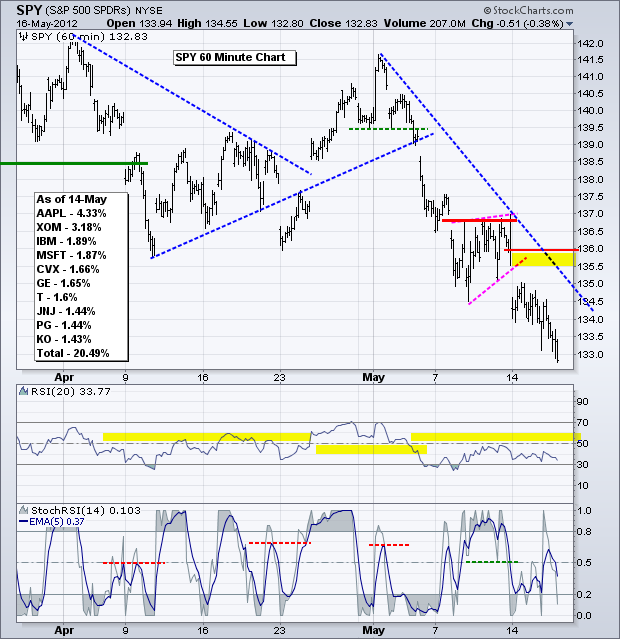
There is not much change on the 60-minute chart as the S&P 500 ETF (SPY) closed below 133 for the first time since February 2nd. January was a big up month so it would take a move below 126 to erase all the gains from 2012. Back to the short-term, SPY remains oversold and in a strong downtrend. The ETF broke below its April lows last week, formed a rising wedge and continued lower with a gap down on Monday. Even though we may see a short-term bounce back towards 134.5-135, I still think this decline will likely end with some sort of washout or selling climax. Best guess for a spike low or a bounce? The 130 level (1300 $SPX) represents a nice round number and the 200-day SMA resides around 128 (1280 $SPX).
**************************************************************************
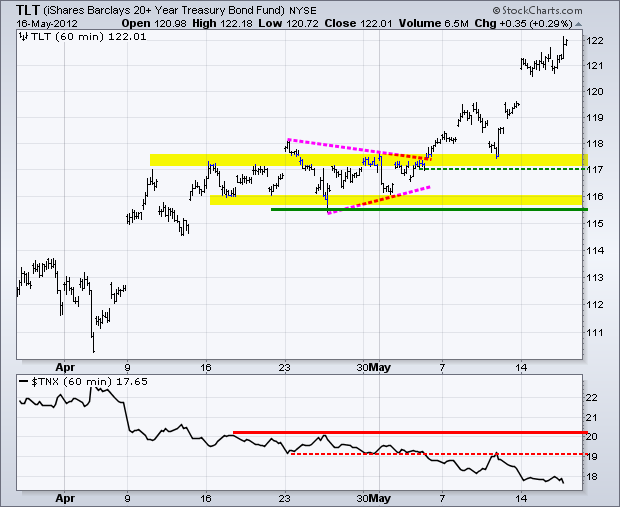
No change. The 20+ Year T-Bond ETF (TLT) surged above 120 and closed above 121 as money moved continued moving into relative safety. TLT is getting quite overbought, but remains in a strong uptrend. Broken resistance in the 117-117.5 area turns into the first support zone to watch. Key support remains at 115.5-116 for now.
**************************************************************************
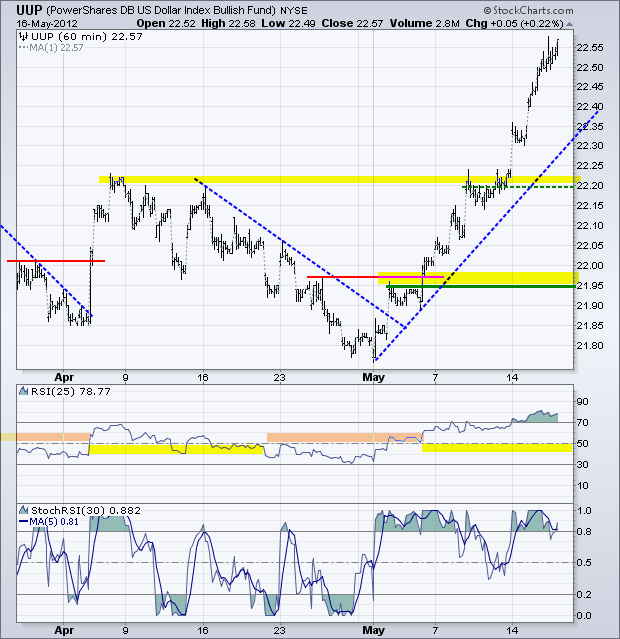
No much change. The US Dollar Fund (UUP) is now up 12 days straight (3.48%), which is the entire month of May. The advance started rather slow, but picked up steam with a 1.05% surge the last two days. This 12 day advance is the strongest since November 2011. More importantly, this thrust is coming off support and the ETF broke the March high. Even though UUP is short-term overbought, the strength of this surge suggests that UUP will exceed the January high.
**************************************************************************
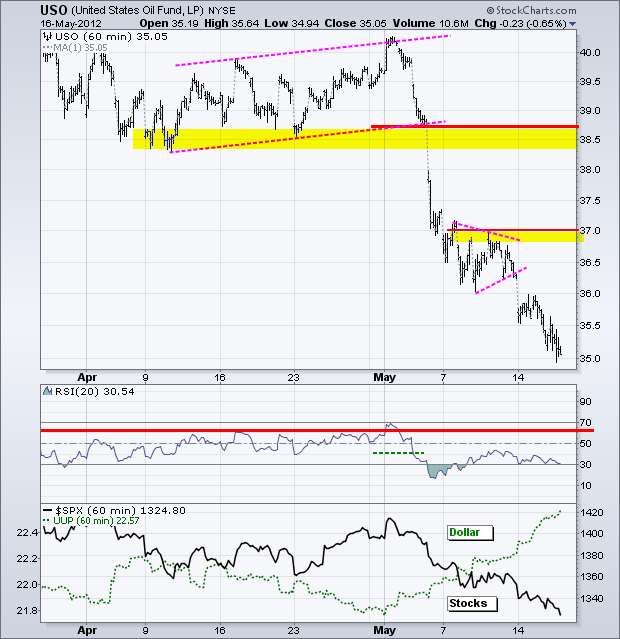
No change. Oil is as oversold as treasuries are overbought. Moreover, note that these two are negatively correlated, as our stocks and treasuries. A pullback in treasuries would likely lead to a bounce in stocks and oil. However, like stocks, this bounce would be deemed an oversold bounce for now. The US Oil Fund (USO) broke pennant support on Monday and this pennant zone marks a resistance zone.
**************************************************************************
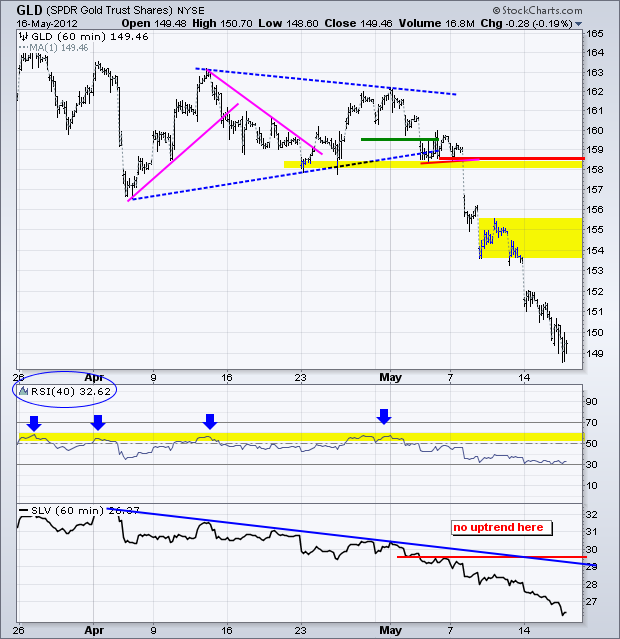
No change. The Gold SPDR (GLD) is very oversold, but just becomes more oversold, which happens in a strong downtrend. GLD is now down some 6% this month and ripe for an oversold bounce. However, GLD remains a falling knife and catching this knife is risky, to say the least. Should GLD bounce, I would mark the first resistance zone around 154-155.
**************************************************************************
Key Economic Reports:
Thu - May 17 - 08:30 – Jobless Claims
Thu - May 17 - 10:00 - Philadelphia Fed
Thu - May 17 - 10:00 - Leading Indicators
Fri - May 18 - 10:00 - TGIF
Sun - Jun 17 - 10:00 – Greek Elections
Charts of Interest: Tuesday and Thursday in separate post.
This commentary and charts-of-interest are designed to stimulate thinking. This analysis is not a recommendation to buy, sell, hold or sell short any security (stock ETF or otherwise). We all need to think for ourselves when it comes to trading our own accounts. First, it is the only way to really learn. Second, we are the only ones responsible for our decisions. Think of these charts as food for further analysis. Before making a trade, it is important to have a plan. Plan the trade and trade the plan. Among other things, this includes setting a trigger level, a target area and a stop-loss level. It is also important to plan for three possible price movements: advance, decline or sideways. Have a plan for all three scenarios BEFORE making the trade. Consider possible holding times. And finally, look at overall market conditions and sector/industry performance.

About the author:
Arthur Hill, CMT, is the Chief Technical Strategist at TrendInvestorPro.com. Focusing predominantly on US equities and ETFs, his systematic approach of identifying trend, finding signals within the trend, and setting key price levels has made him an esteemed market technician. Arthur has written articles for numerous financial publications including Barrons and Stocks & Commodities Magazine. In addition to his Chartered Market Technician (CMT) designation, he holds an MBA from the Cass Business School at City University in London.
Learn More
