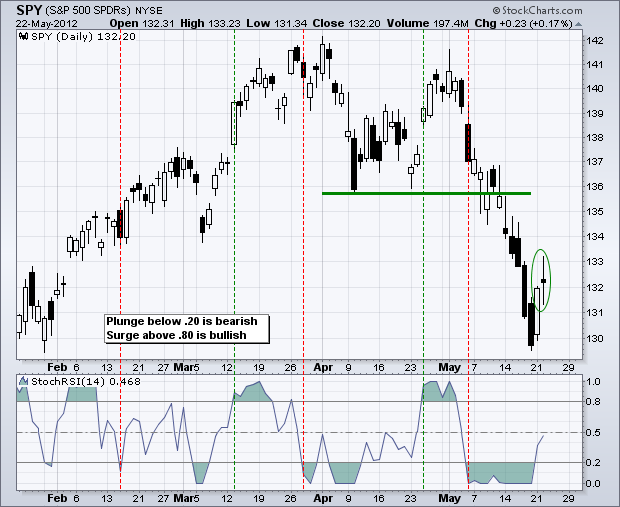
After a one day oversold bounce, stocks stalled on Tuesday as indecisive candlesticks formed on many charts. The Russell 2000 ETF (IWM) and the Russell Microcap Fund (IWC) closed lower and showed relative weakness. The S&P MidCap 400 SPDR (MDY), however, eked out a small gain and showed some relative strength. The nine sectors were mixed with four down and five up. The chart below shows the S&P 500 ETF (SPY) with a spinning top candlestick forming. Notice that the open and close are nearly equal, which creates a small candlestick body. Intraday, the ETF surged above 133 and plunged below 131.50, but ended in the middle of its range. Again, a finish in the middle reflects a stalemate between bulls and bears.
The indicator window shows StochRSI, which the 14-day Stochastic Oscillator applied to 14-day RSI. It is RSI on steroids. A surge above .80 shows a bullish momentum thrust, while a plunge below .20 reflects a bearish momentum thrust. StochRSI plunged below .20 the first week of May and a surge above .80 is needed to negate this signal. In other words, we need to see follow through to Monday's surge.
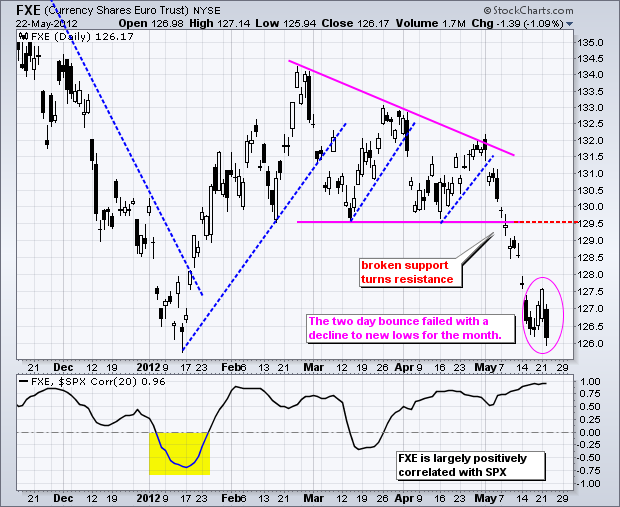
The Euro continues to drive global trading and I would not expect concrete action anytime soon. EU leaders have been behind the curve for years and I would not expect this to change now. Even though EU leaders are meeting today and there is a great opportunity to act now, their backs are not against the wall just yet. As we have seen time and time again, EU leaders do not act until the last minute. Actually, they usually act a few minutes after the last minute. It is just the nature of government and politics the world over. Push will not come to shove until the Greek elections, which are on June 17th. Until then, we can expect Eurobond rumors and to ebb and flow over the coming weeks with little action until the second week of June, at the earliest. The Euro Currency Trust (FXE) tells the tale as the ETF declined to new lows for the month on Tuesday.
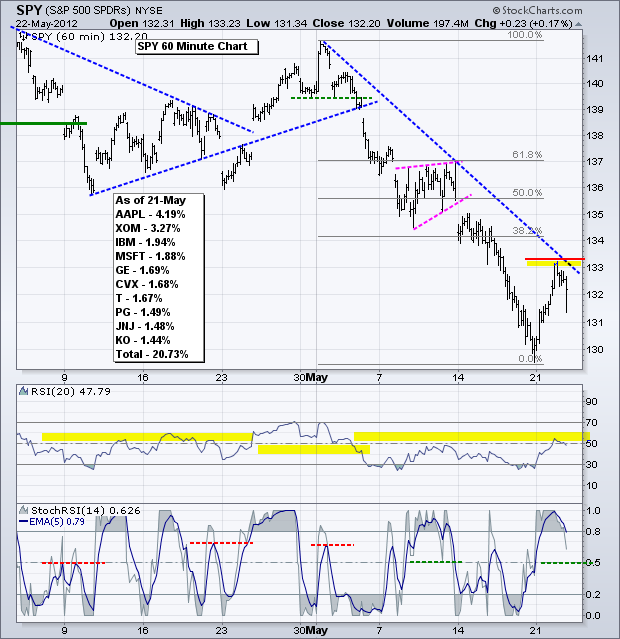
On the 60-minute chart, the S&P 500 ETF (SPY) surged to the May trendline and pulled back in the afternoon. SPY hit resistance below the 38.2% retracement and RSI hit resistance in the 50-60 zone. StochRSI moved above .80 to become short-term overbought. A move back below .50 would suggest that short-term momentum is turning bearish again. At this point, follow through above 133.15 in SPY and 60 in RSI is needed for an early reversal signal. While such a move would be short-term bullish, I would still view the advance as a correction within a bigger downtrend and expect resistance in the 135-136 area.
**************************************************************************
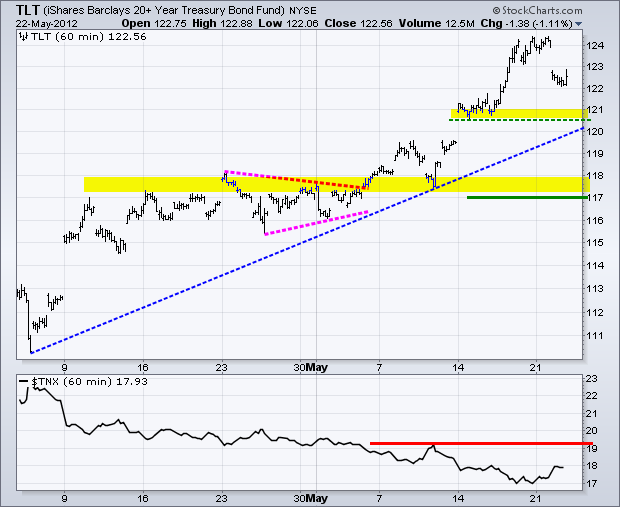
The 20+ Year T-Bond ETF (TLT) pulled back with a rather sharp decline, but this is still a correction within a bigger uptrend. The medium-term trend (daily chart) and short-term trend (60-minute chart) are clearly up. TLT just got quite overbought and needed a rest. First support remains at 120.5 and key support at 117.
**************************************************************************
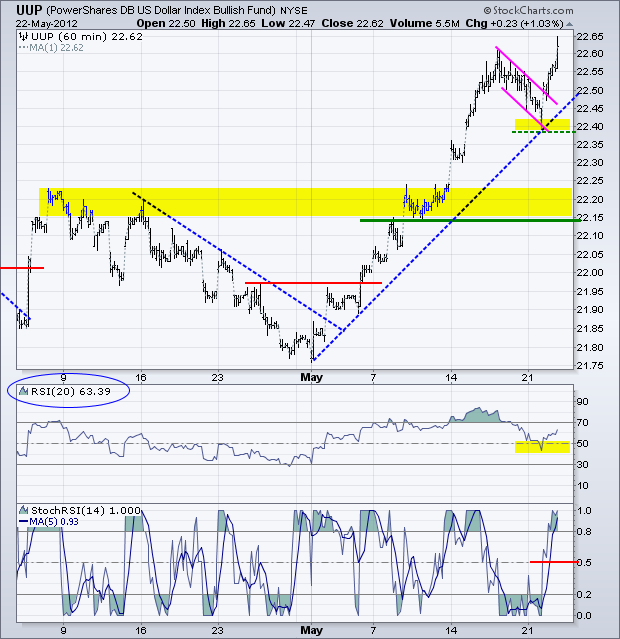
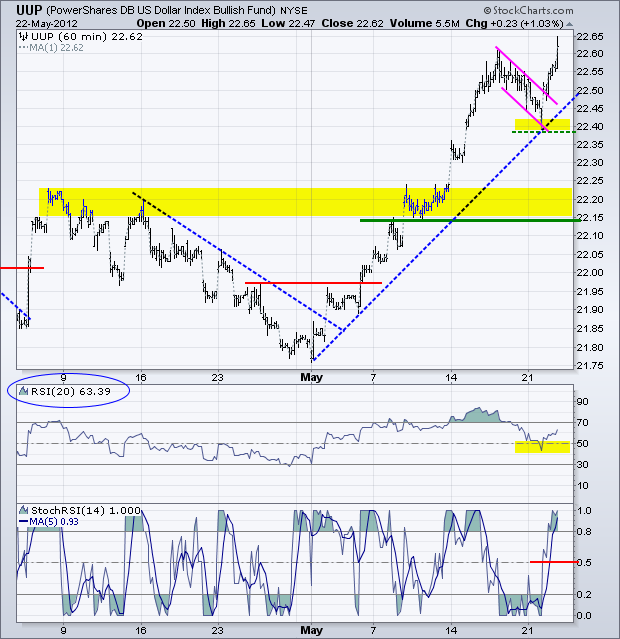
The US Dollar Fund (UUP) pulled back on Friday-Monday and then surged to a new high on Tuesday. Talk about a short pullback. RSI found support in the 40-50 zone and StochRSI surged above .50 to signal a resumption of the uptrend. First support is now set at 22.33 and key support at 22.15.
**************************************************************************
A surge in the Dollar and mixed action in the stock market weighed on oil as the US Oil Fund (USO) moved below 34.50 on Tuesday. With this decline, we can now mark first resistance at 35.25 and a break above this level would argue for a bigger oversold bounce, perhaps back towards the prior pennant zone (36-37).
**************************************************************************
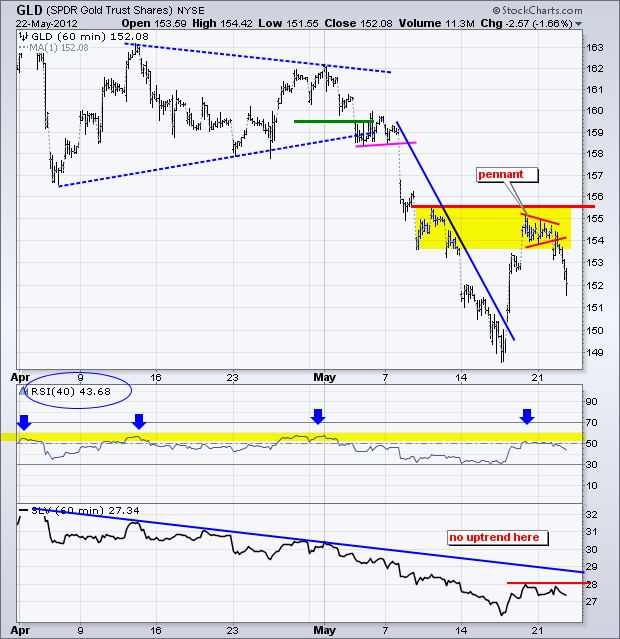
Once again, 40-period RSI hit resistance in the 50-60 zone and the Gold SPDR (GLD) turned lower to continue its downtrend. RSI at this setting has defined the downtrend since late March. A break above 60 is needed to turn momentum bullish. On the price chart, GLD formed a pennant, but broke support instead of resistance. This marks another failure and keeps the bigger downtrend alive. We can now set key resistance at 155.50.
**************************************************************************
Key Economic Reports:
Wed - May 23 - 07:00 - MBA Mortgage Index
Wed - May 23 - 10:00 - New Home Sales
Wed - May 23 - 10:00 - FHFA Housing Price Index
Wed - May 23 - 10:00 – EU Summit
Wed - May 23 - 10:30 - Oil Inventories
Thu - May 24 - 08:30 - Jobless Claims
Thu - May 24 - 08:30 - Durable Orders
Fri - May 25 - 09:55 - Michigan Sentiment
Sun - Jun 17 - 10:00 – Greek Elections
Charts of Interest: Tuesday and Thursday in separate post.
This commentary and charts-of-interest are designed to stimulate thinking. This analysis is not a recommendation to buy, sell, hold or sell short any security (stock ETF or otherwise). We all need to think for ourselves when it comes to trading our own accounts. First, it is the only way to really learn. Second, we are the only ones responsible for our decisions. Think of these charts as food for further analysis. Before making a trade, it is important to have a plan. Plan the trade and trade the plan. Among other things, this includes setting a trigger level, a target area and a stop-loss level. It is also important to plan for three possible price movements: advance, decline or sideways. Have a plan for all three scenarios BEFORE making the trade. Consider possible holding times. And finally, look at overall market conditions and sector/industry performance.

