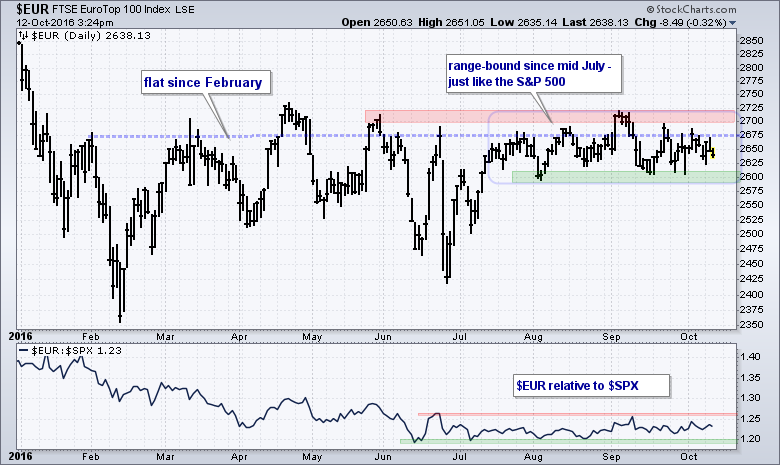
As with the S&P 500, the Eurotop 100 ($EUR) has gone nowhere since mid July and I am focused on the recent range for the first directional clues. Trading is quite choppy within the range and it remains anyone's guess what will happen within this range. Even though a strong directional move is not guaranteed after a range break, the direction of the break will provide the best indication for the next move. An upside break at 2725 would be bullish and suggest a strong finish to the year. A downside break at 2590 would be bearish and suggest a test of the 2016 lows.
The indicator window shows the performance of the Eurotop 100 relative to the S&P 500. $EUR underperformed $SPX from January to June as the price relative fell the first six months of the year. Relative performance has since flattened out as $EUR performed in line with the S&P 500 over the last three months. Note that the S&P 500 has also been flat since mid July. Chartists, therefore, can watch both for directional breaks that would influence global equity markets.
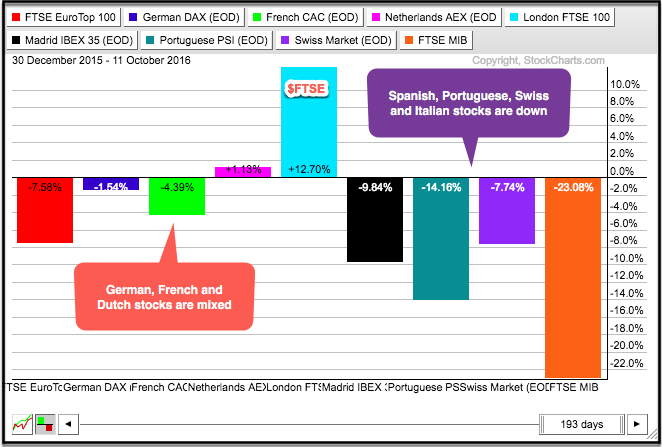
The PerfChart below breaks down the European equity market into eight countries and this makes it easy to see the weaker links. The German DAX Index ($DAX) and French CAC Index ($CAC) are down slightly, while the Netherlands AEX ($AEX) is up slightly. The FTSE Index ($FTSE) sports the biggest gains by far, but this is priced in British Pounds and the currency has weakened significantly over the past few weeks.
 The right half of the chart shows three of the so-called peripheral countries with sharp losses year-to-date. The Madrid IBEX ($IBEX), the Portuguese Stock Index ($PSI) and Milan Index ($MIB) are down more than 9%. The fourth index on this chart is the Swiss Market Index ($SMI), which is down 7.74% year-to-date.
****************************************
Thanks for tuning in and have a great day!
--Arthur Hill CMT
Plan your Trade and Trade your Plan
****************************************

