ChartWatchers August 30, 2019 at 10:31 PM
For most investors, it's been a tough month as headline induced volatility brought the Indexes to their worse August returns since 2015... Read More
ChartWatchers August 30, 2019 at 10:15 PM
Listen, the media loves to overhype the trade war. Seriously, is there anyone that isn't aware of the trade war, the tweets, the rhetoric, etc... Read More
ChartWatchers August 30, 2019 at 10:09 PM
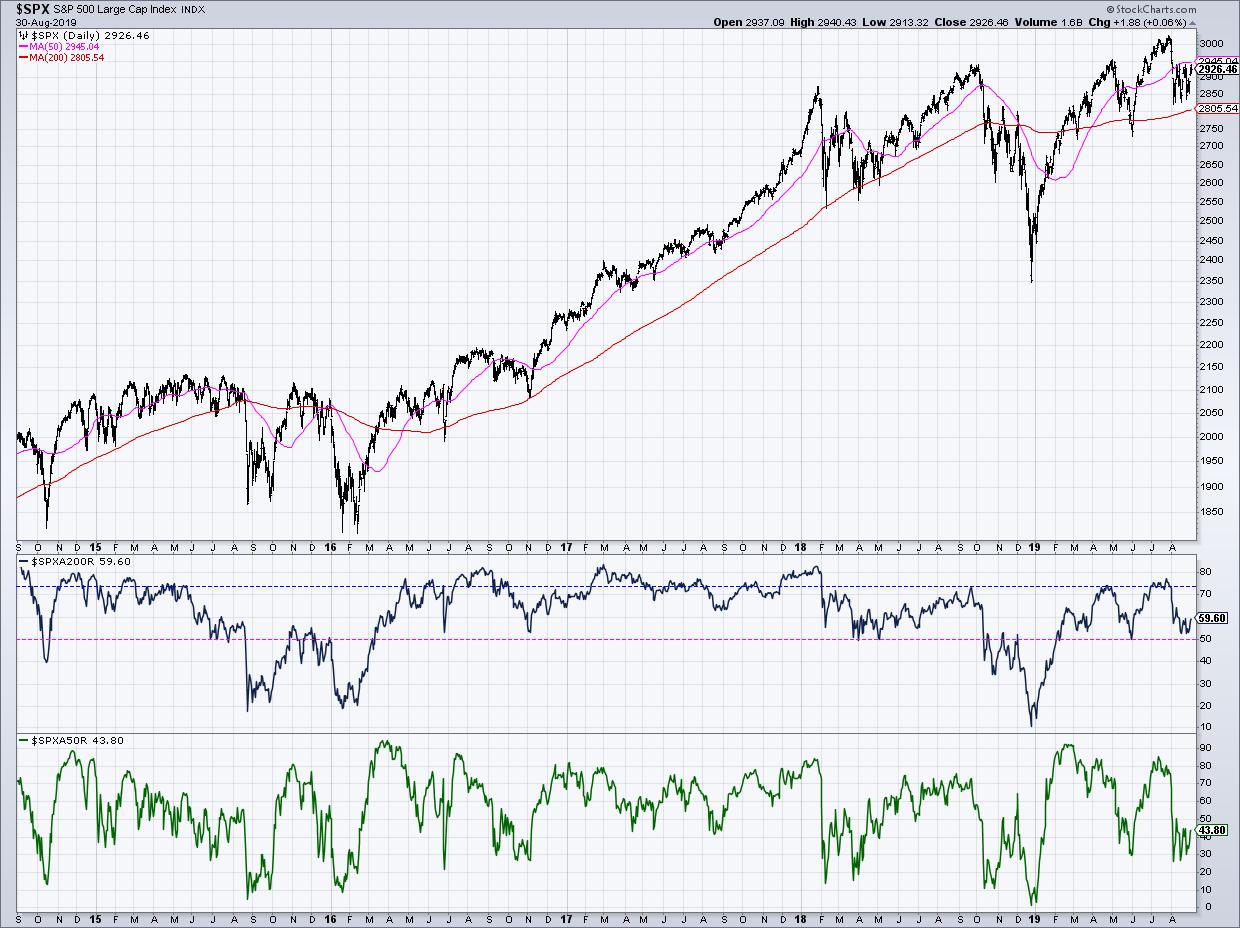
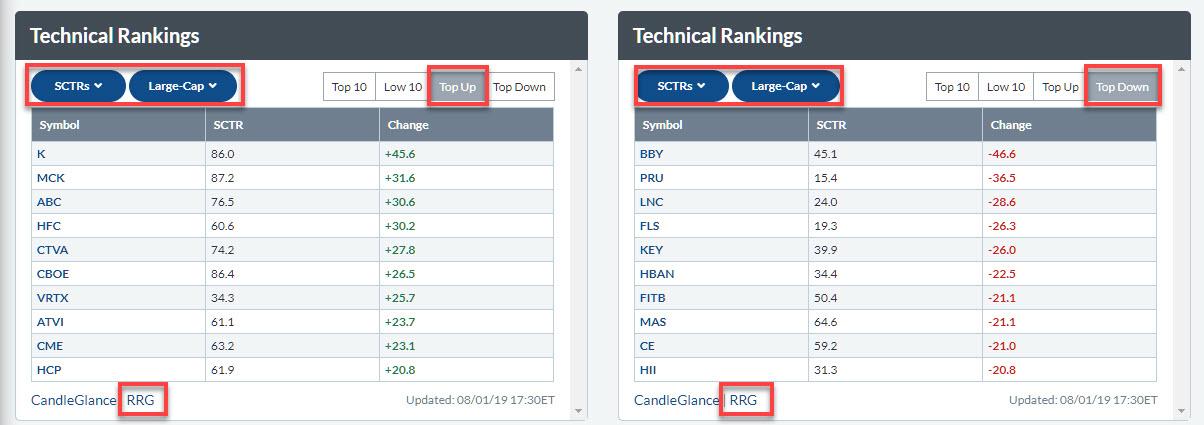
I recently tweeted about the percent of stocks above their 200-day moving averages, pointing out that there is a key line in the sand for this important breadth indicator. This resulted in a fantastic question about looking at market breadth in cap-weighted terms vs... Read More
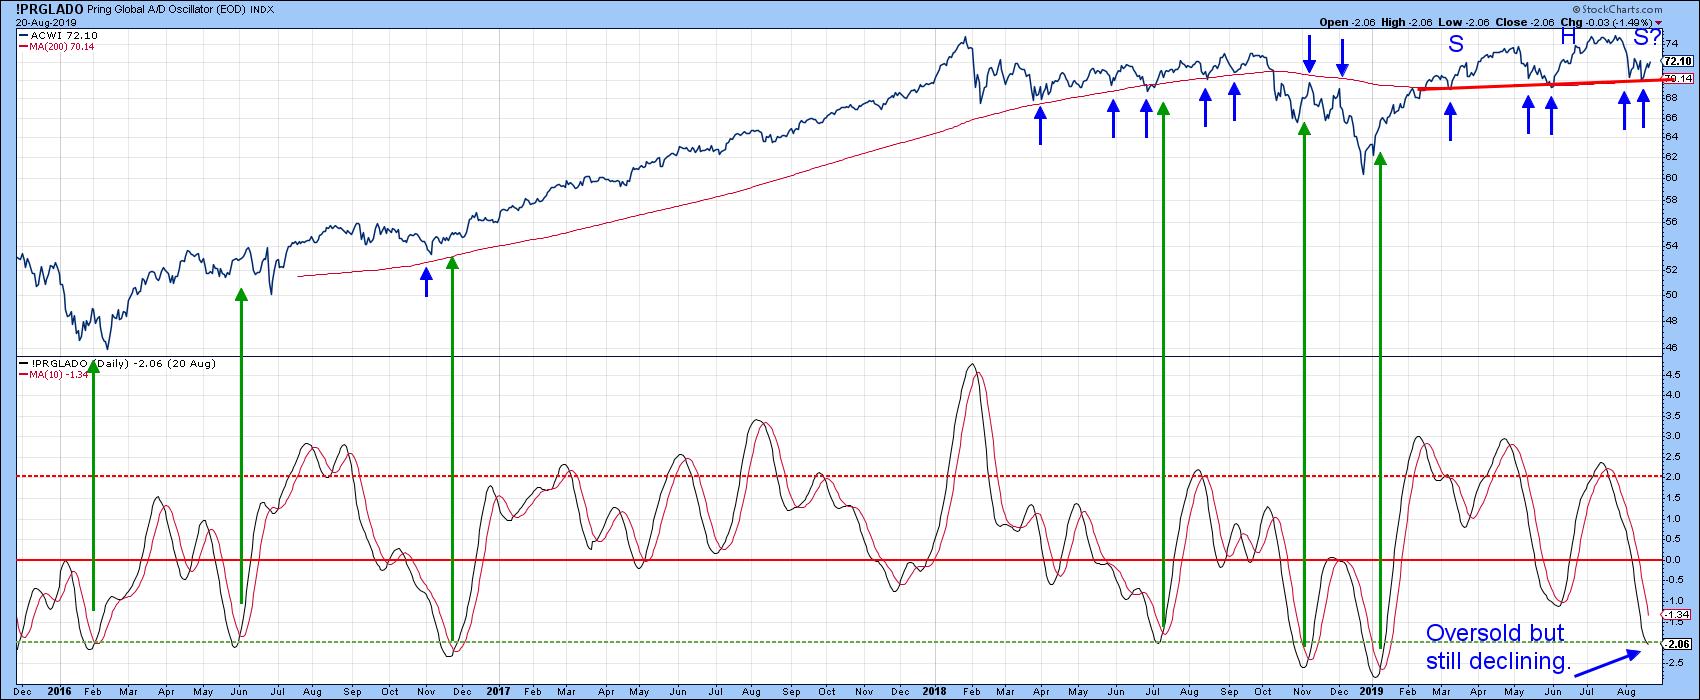
ChartWatchers August 30, 2019 at 05:31 PM
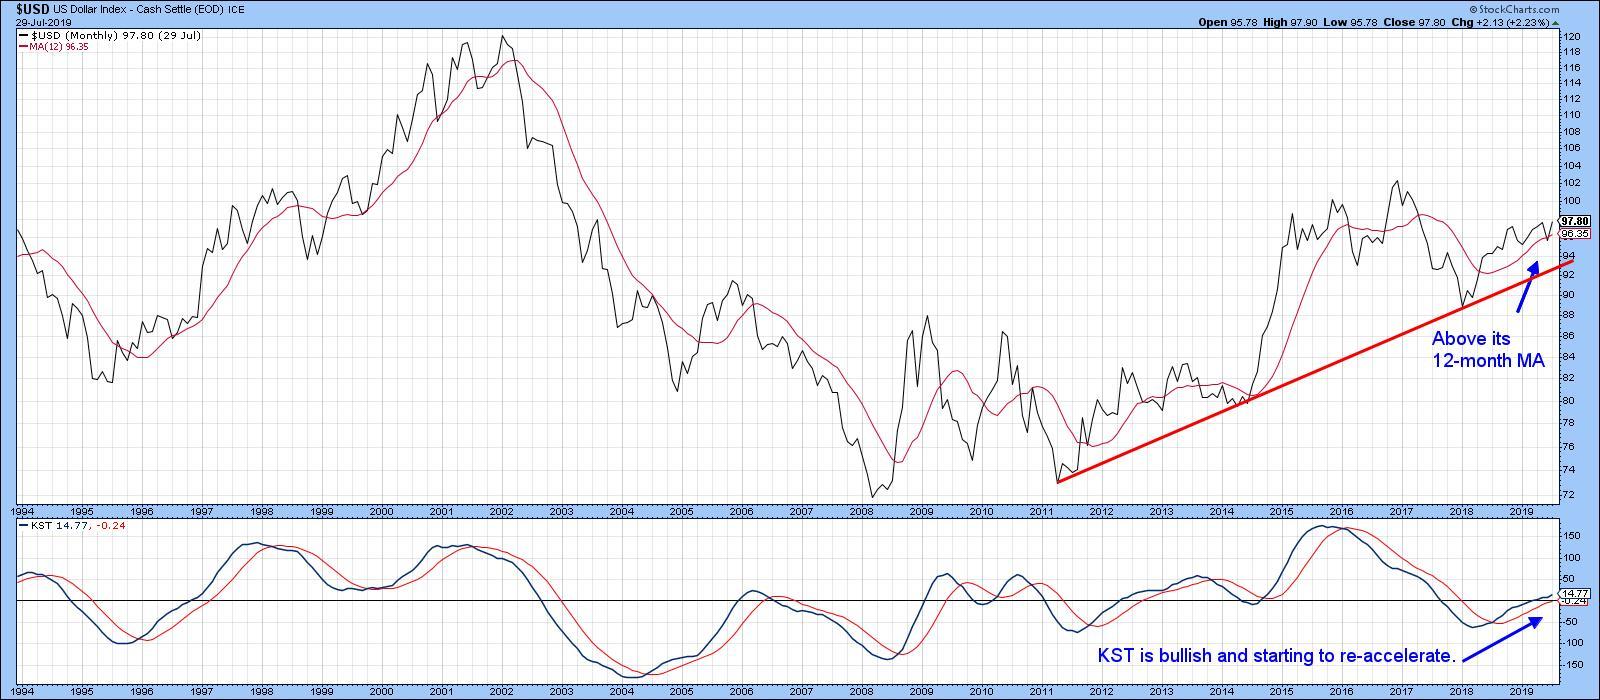
Editor's Note: This article was originally published in Martin Pring's Market Roundup on Wednesday, August 27th at 4:15pm ET... Read More
ChartWatchers August 30, 2019 at 01:46 PM
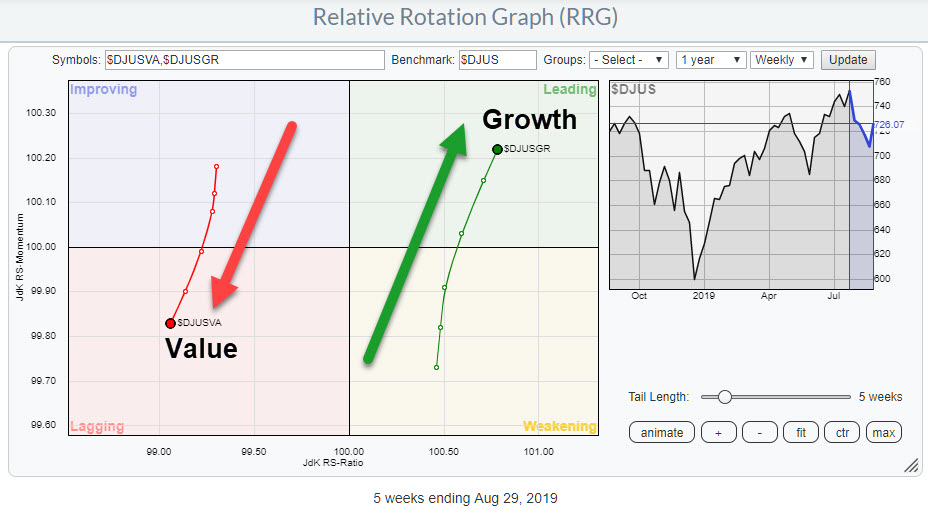
One of the Relative Rotation Graphs that I like to keep an eye on in order to get a handle on the general market condition (for stocks) is the chart above, which shows the rotation of Value versus Growth stocks using the Dow Jones US Index as the benchmark... Read More
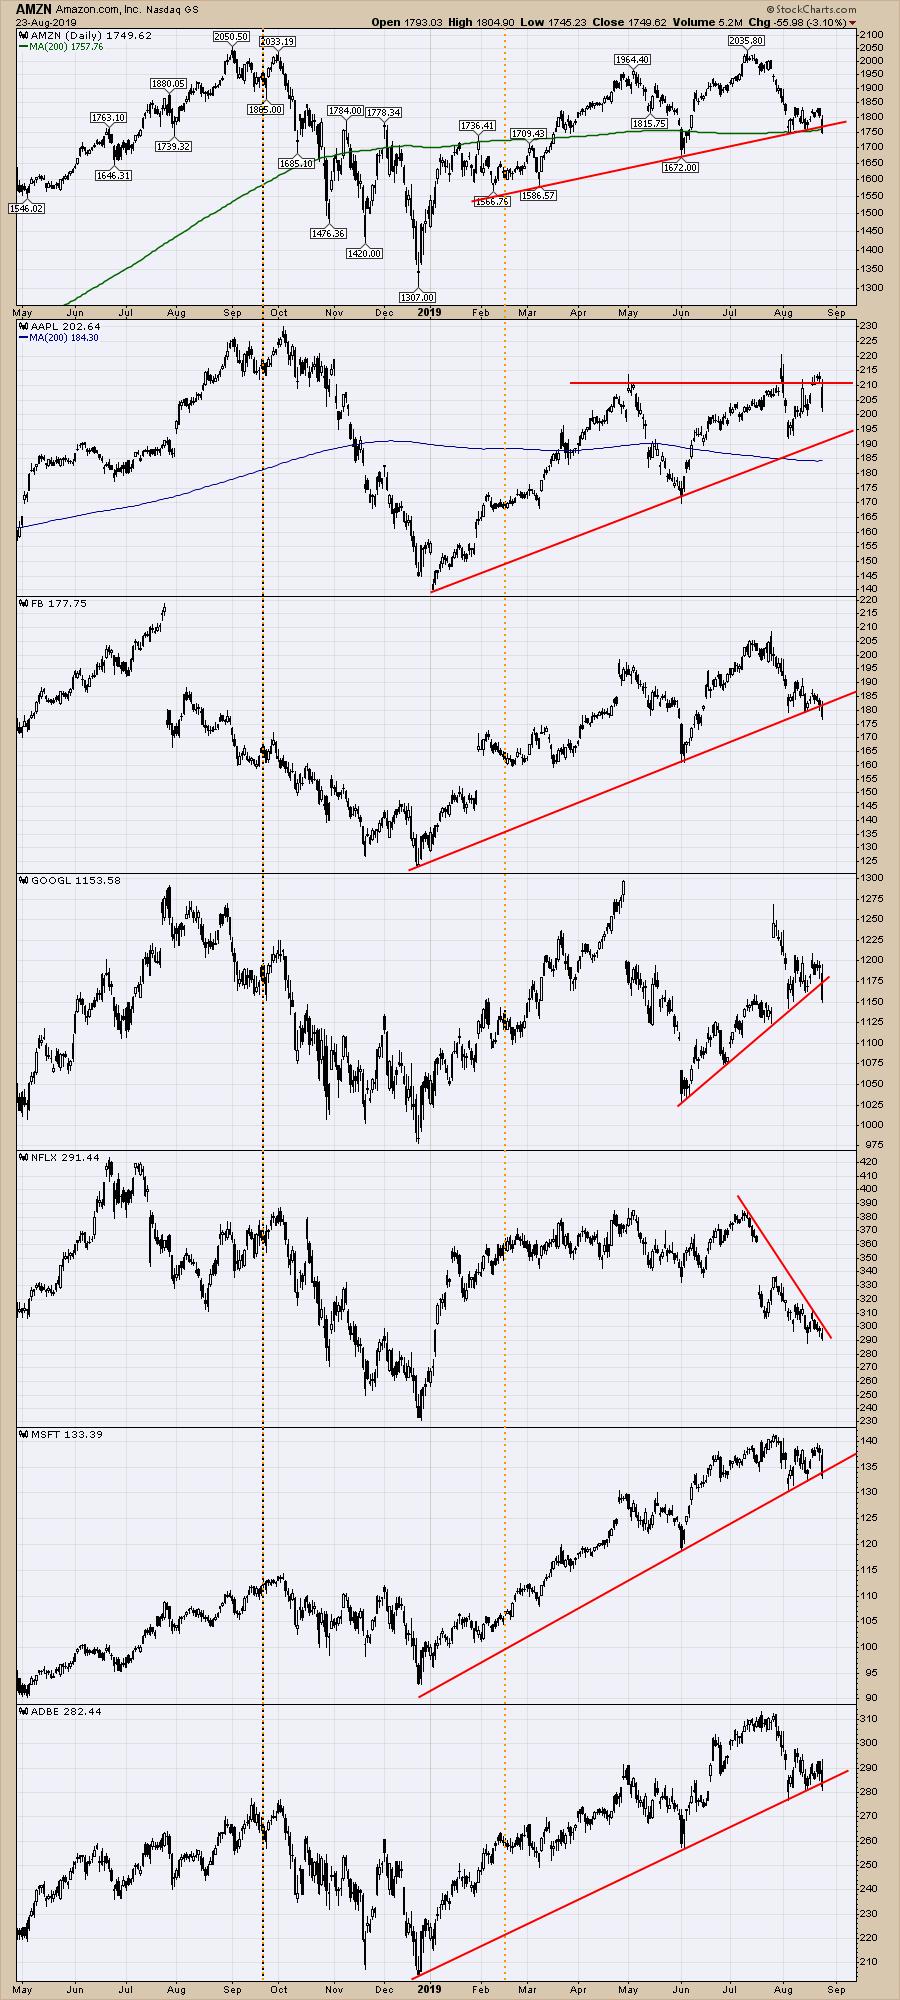
ChartWatchers August 24, 2019 at 08:56 AM

Stocks were hit hard in early August with SPY and QQQ falling six to seven percent in six days. These declines started from new highs in late July, which is when these prizefighters were at peak performance... Read More
ChartWatchers August 23, 2019 at 09:26 PM
Editor's Note: This article was originally published in Martin Pring's Market Roundup on Wednesday, August 21st at 9:36pm ET. During my many decades in this business, I have never heard of a recession so well-advertised as the one we are witnessing currently... Read More
ChartWatchers August 23, 2019 at 09:06 PM
Last week, Mary Ellen McGonagle and I had the pleasure of speaking at The Money Show as part of the "Women on Wealth" panel, where we discussed how we can bring women to the "investment table" through education, engagement and empowerment... Read More
ChartWatchers August 23, 2019 at 08:42 PM
Recently, Tom Bowley announced to the StockCharts community that he will soon be returning to his "roots" at EarningsBeats.com. When Tom first approached me with the idea, I let out a big "Woohoo!"... Read More
ChartWatchers August 23, 2019 at 04:15 PM

The 20+ YR T-Bond ETF (TLT) and Gold SPDR (GLD) are on a tear, but they are getting stretched by one key metric and could be ripe for a corrective period. There are numerous ways to measure overbought (extended) conditions... Read More
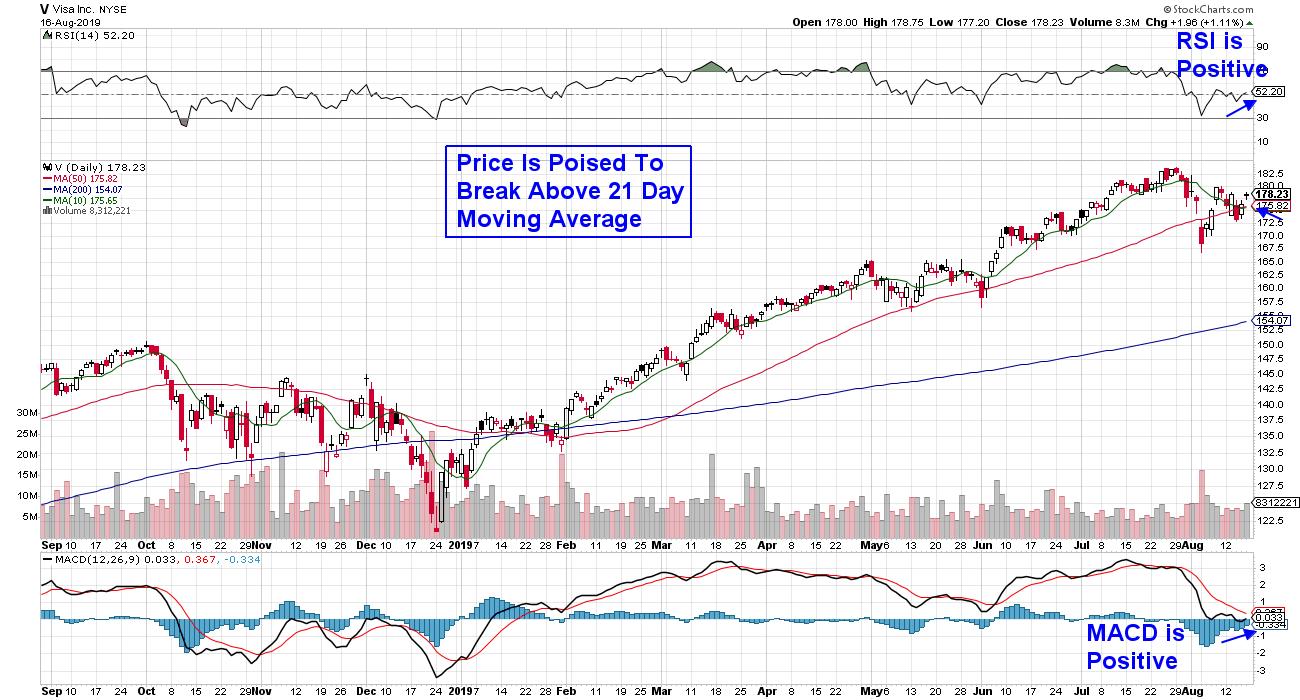
ChartWatchers August 23, 2019 at 01:47 PM
One of the interesting parts about the markets over the last few weeks has been the quiet price action in the large cap tech names, in contrast to Consumer Staples names like Wal-Mart (WMT) and Target (TGT) being fantastic performers this year... Read More
ChartWatchers August 17, 2019 at 12:41 PM
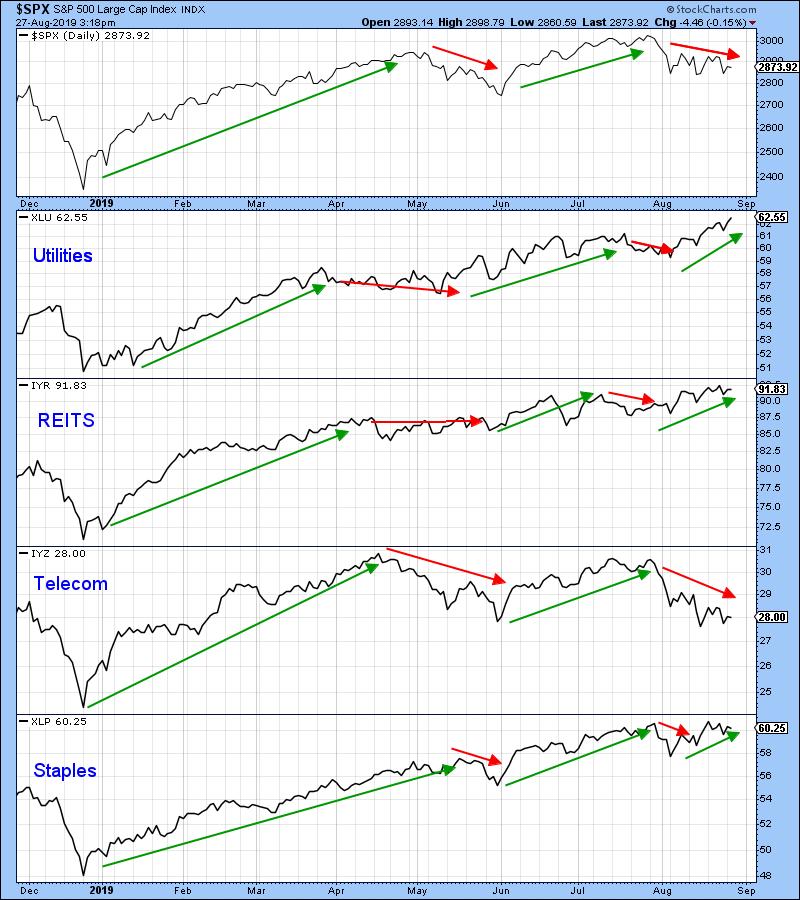
The volatility in the markets remains as investors continue to grapple with the latest global headline. With defensive areas of the market generally posting positive results, other areas are struggling to regain their footing following sharp selloffs... Read More
ChartWatchers August 16, 2019 at 06:04 PM
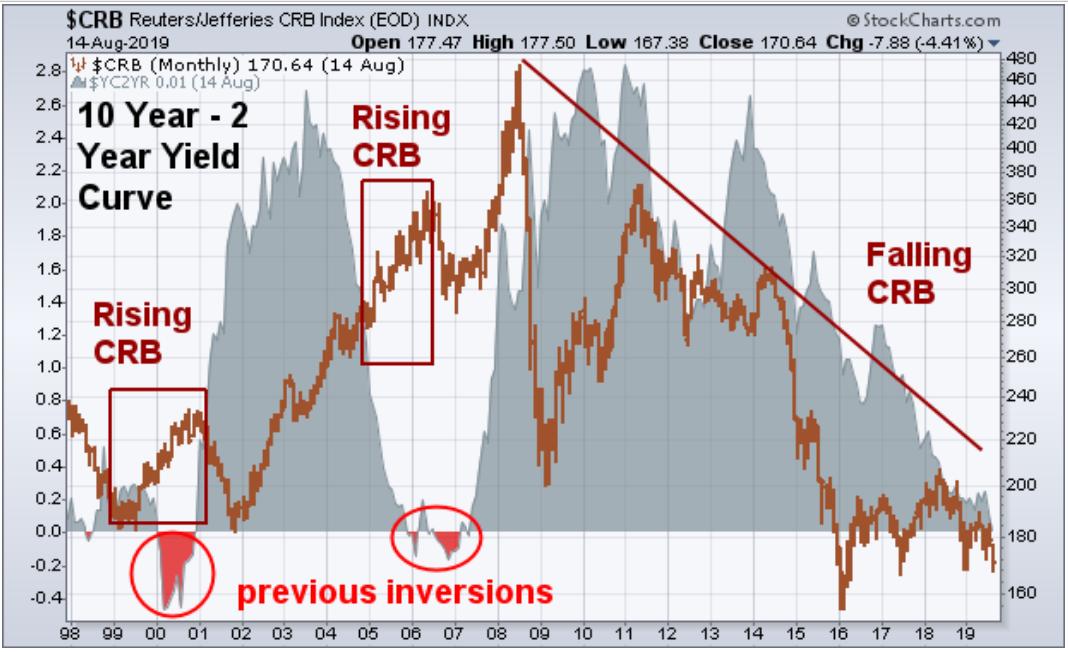
Editor's Note: This article was originally published in John Murphy's Market Message on Thursday, August 15th at 3:47pm ET. Everyone's talking about inverted yield curves. The 10 year - 3 month yield curve turned negative a few months ago... Read More
ChartWatchers August 16, 2019 at 05:30 PM

Relative Rotation Graphs, or "RRGs", were born while I was working as a sell-side analyst for an investment bank in Amsterdam, doing research and making calls on stocks and sectors... Read More
ChartWatchers August 16, 2019 at 03:12 PM
Wow, it's been a great ride here at StockCharts.com! I posted essentially this same article in my Trading Places blog a week ago, but I'm not sure how many of you follow me there. I want to make sure I reach out to everyone who has supported me over the years... Read More
ChartWatchers August 09, 2019 at 10:45 PM
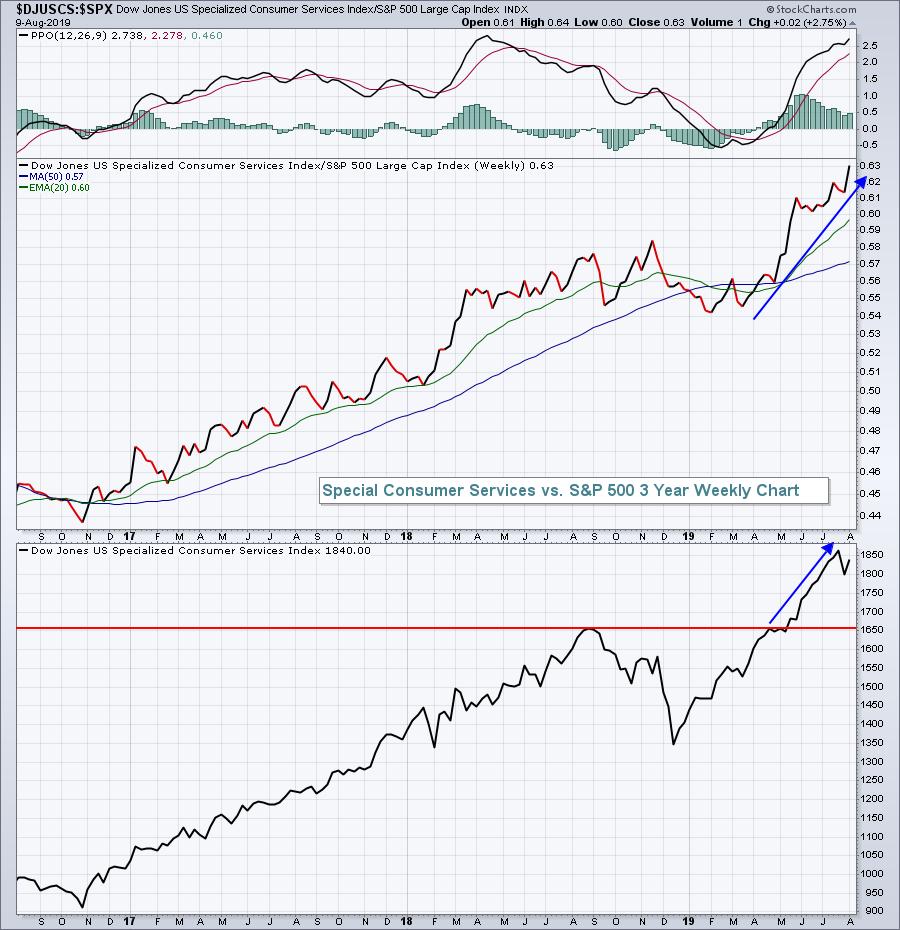
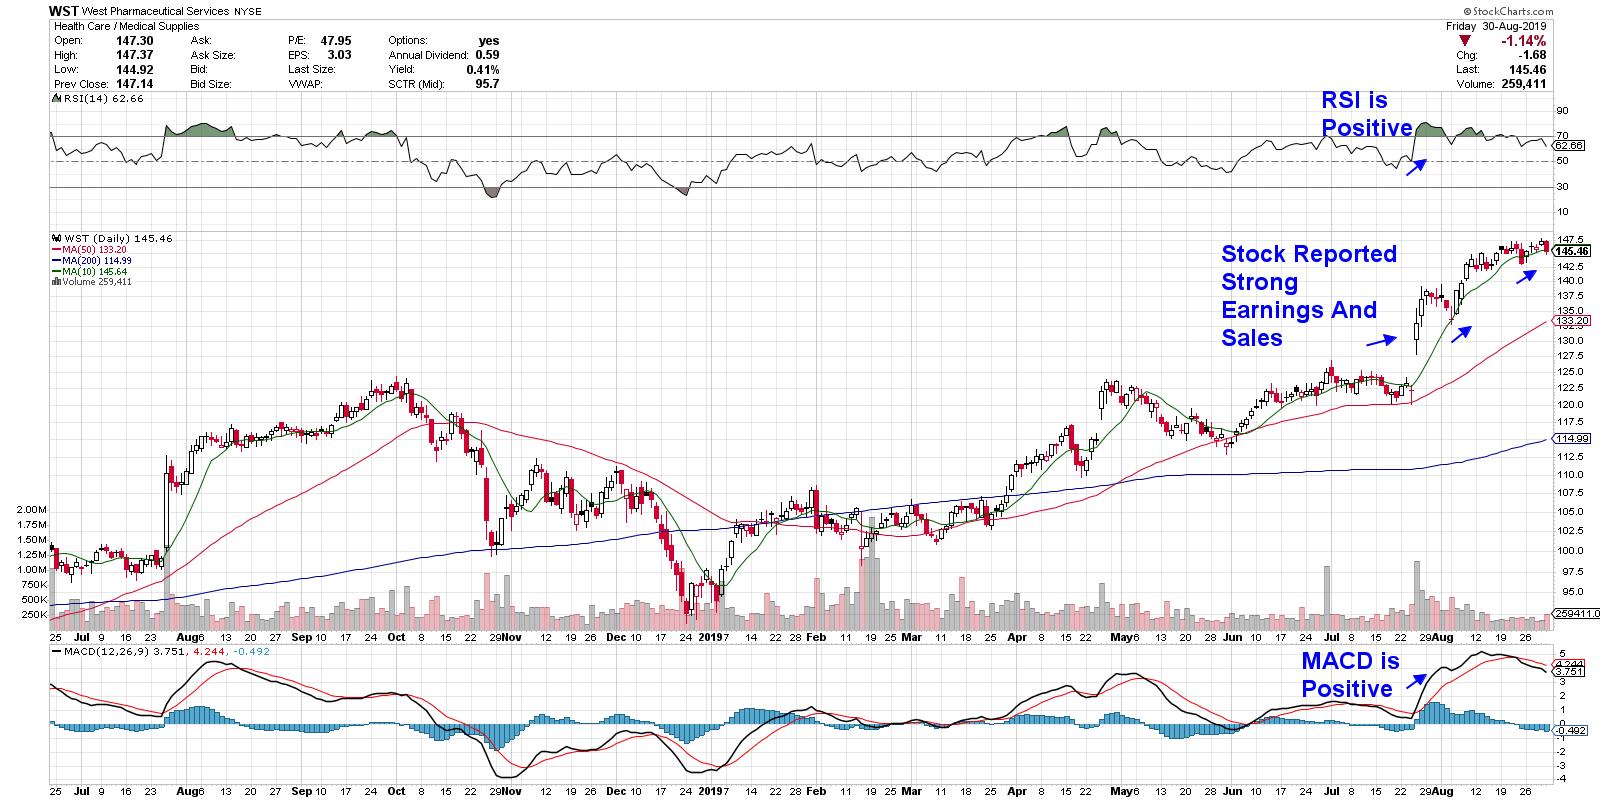
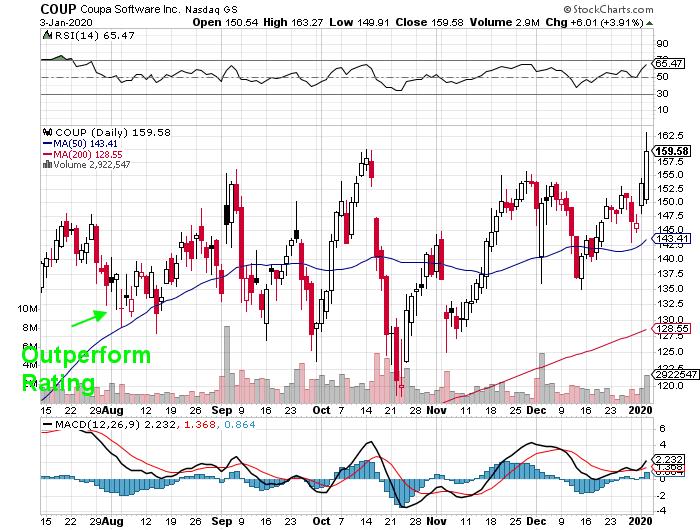
I know it's summer, and we generally think defensively during this time of year, but there are still very strong areas with tremendous momentum that you should be considering. I'll give you my top five industry groups with a stellar individual stock performer within each group... Read More
ChartWatchers August 09, 2019 at 08:44 PM
The world is full of charts. Rick Santelli used the expression "Every ship at the bottom of the ocean also had a chart room." There's an important caveat, there, however: Were the navigators looking at the charts? Stock charts only tell you something if you want to hear it... Read More
ChartWatchers August 09, 2019 at 07:45 PM
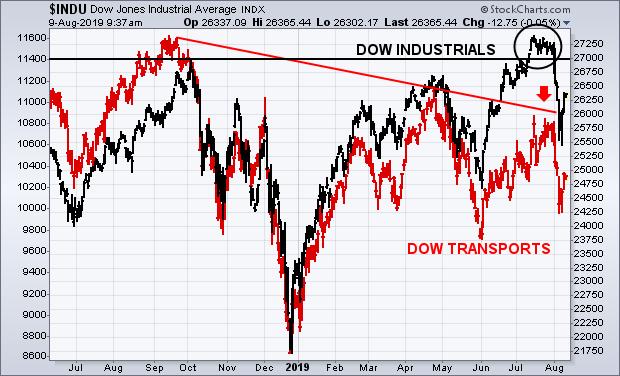
One thing that we technical analysts like to spot at price tops is an indicator flashing a negative divergence, which is an indicator that is trending downward while price continues to trend upward... Read More
ChartWatchers August 09, 2019 at 05:52 PM
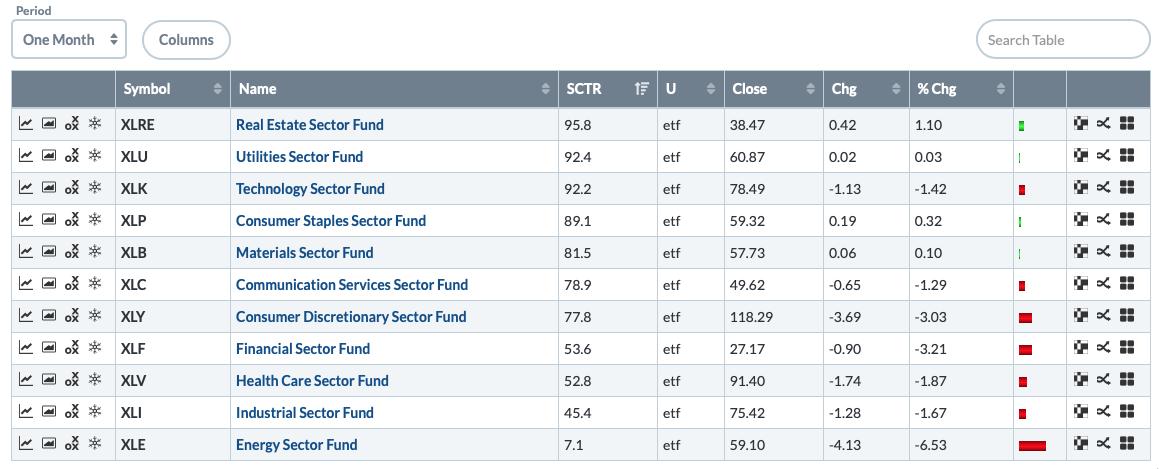
John Murphy joined us on MarketWatchers LIVE on Thursday (8/8/19) and showed us some very interesting charts on the Sector SPDRs. The deterioration of nearly all of them prompted me to look at them using the Price Momentum Oscillator (PMO) in CandleGlance... Read More
ChartWatchers August 09, 2019 at 02:18 PM
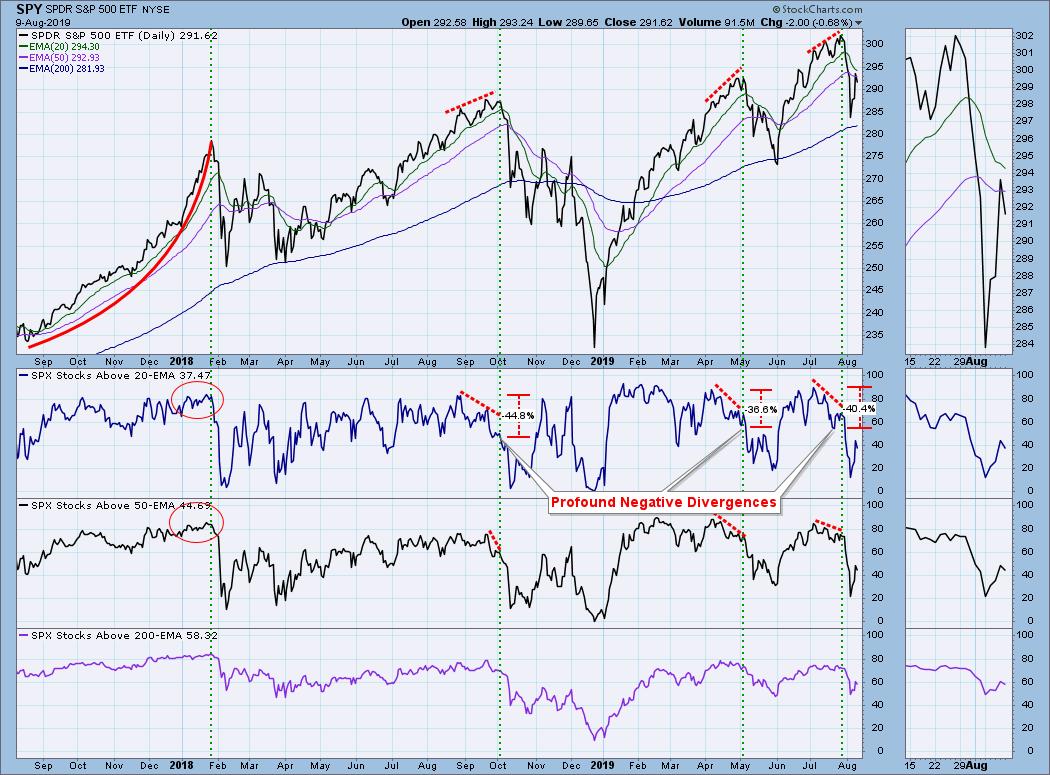
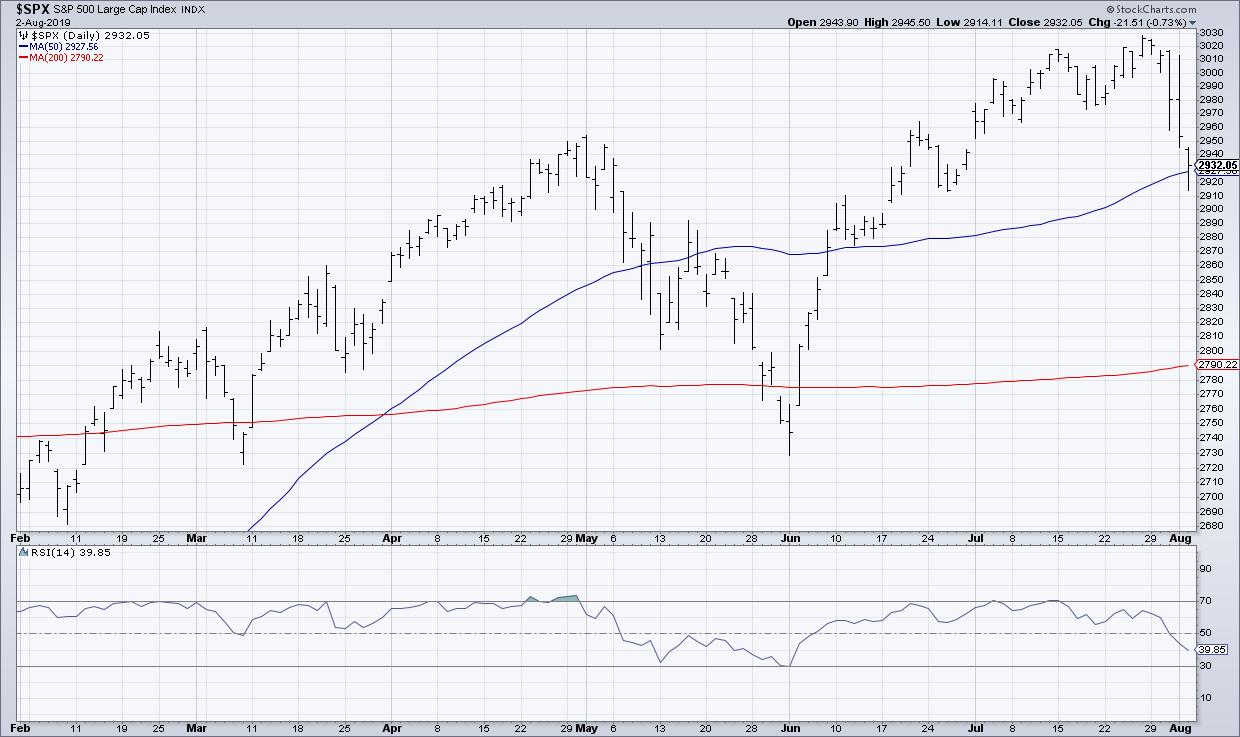
The S&P 500 hit a new high in late July and then got pummeled in early August with a sharp decline that broke the 50-day EMA. Moving averages like this can serve benchmark levels that chartists can use to compare performance... Read More
ChartWatchers August 09, 2019 at 01:53 PM
Editor's Note: This article was originally published in John Murphy's Market Message on Friday, August 9th at 12:27pm ET... Read More
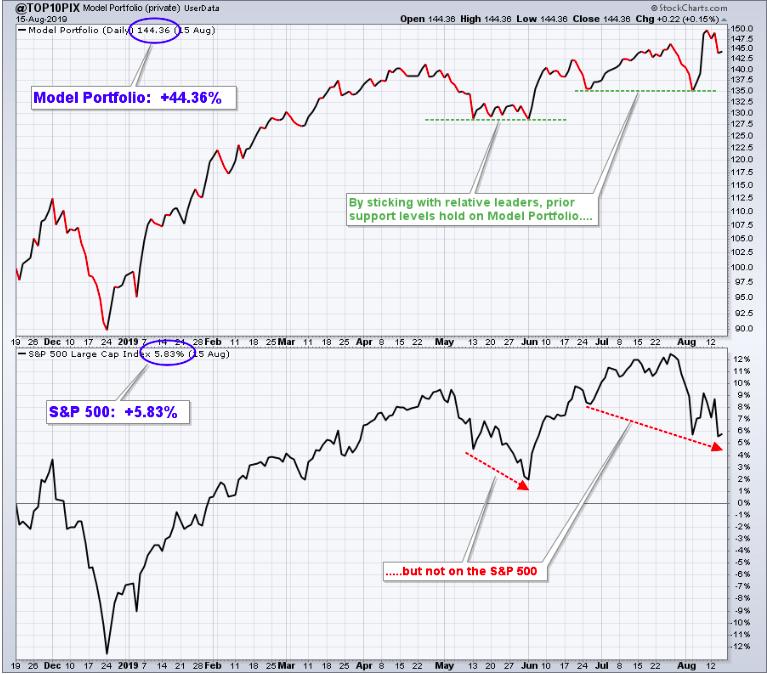
ChartWatchers August 02, 2019 at 10:31 PM
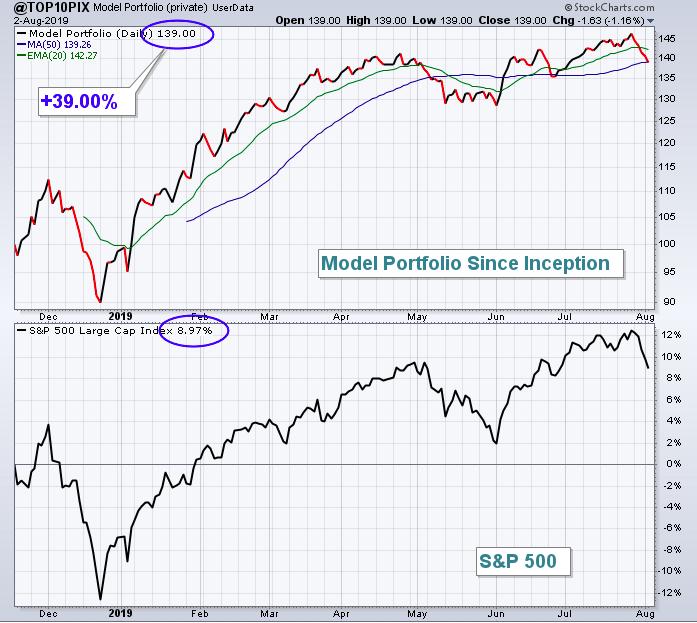
(This is a reprint of a Trading Places blog article written a week ago. I've updated the performance and charts to include last week's selloff.) Beating the S&P 500 is my #1 goal... Read More
ChartWatchers August 02, 2019 at 08:41 PM
The bears were awakened last week following Fed Chair Powell's remarks, as well as Trump's trade war tweets. Both events brought the markets to their knees, with each of the major indices pulling back to their 50-day moving averages... Read More
ChartWatchers August 02, 2019 at 07:28 PM
Editor's Note: This article was originally published in Martin Pring's Market Roundup on Tuesday, July 30th at 1:14pm ET... Read More
ChartWatchers August 02, 2019 at 05:00 PM
"Never confuse brains with a bull market." When the market is going higher and the average stock is appreciating, we often attribute the gains to our skill as investors... Read More
ChartWatchers August 02, 2019 at 01:08 PM
In my latest "Don't Ignore This Chart" article, I used a Relative Rotation Graph holding 20 stocks as a starting point to find an interesting-looking rotation and a possible trading opportunity for BHGE... Read More