One of the more interesting phenomena this week is the separation of investors across broad areas of the market. The bulls are firmly in the bull camp, with no retest of the lows expected. The bears are firmly in the bear camp and expect the market to fall. As the market goes up without them, the fear of missing out becomes more ingrained.
For the tech stock community, they are the happier-than-ever investors. There cannot be a stronger attachment to the concept that the tech names will definitely be the train to ride through this dislocation. The top 5 tech stocks dominate every move in the index. The stay-at-home tech names, the teledoc ideas, are riding the tech trend as well.
For the oil and gas industry, the bears are dominating the discussion. Will the first move back be onto the subways and metros? How much lower will it go?
And then we arrive at the Gold business. The gold industry appears to be having a moment of tension. While the price of the bullion has climbed to new highs, the miners have been unable to push to new highs, suggesting a divergence. This divergence has shown up at a major high, and potential reversals in the bullion ounce price.
On the chart below, Gold started to underperform the $SPX just after the March 23rd low. While gold went up when the market went up, it has actually underperformed the index since then. Notice the red downtrend.
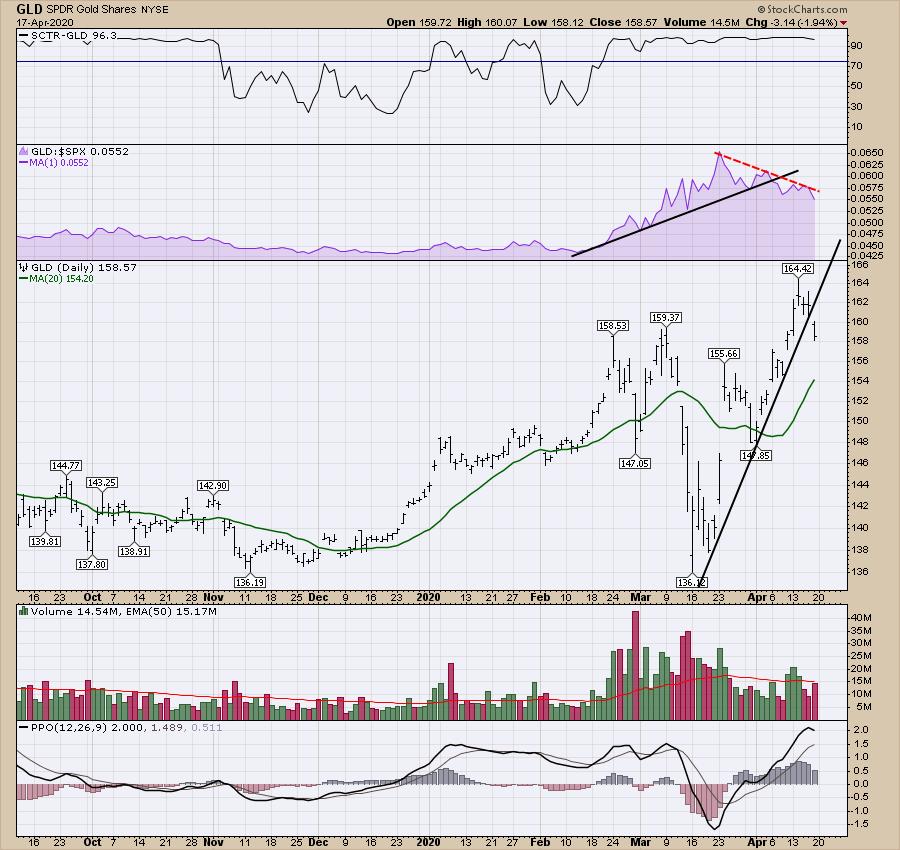
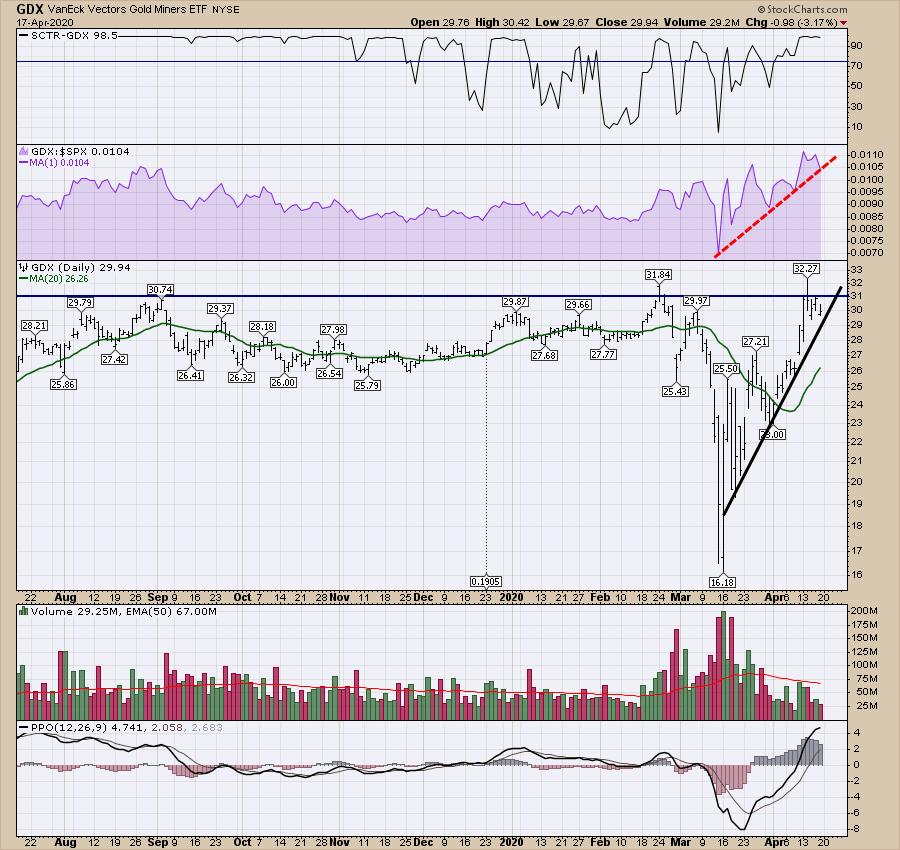
Looking at the gold miners below, we can see they have been unable to break out and hold new highs. With gold spending a week above the $160 breakout level, we still don't see that breakout action in the miners. In terms of relative strength (in purple), the gold miners are still outperforming the $SPX, as the purple area is still trending higher. If this uptrend also breaks (Gold broke it above), that makes gold and related trades look more likely to go lower, not higher.
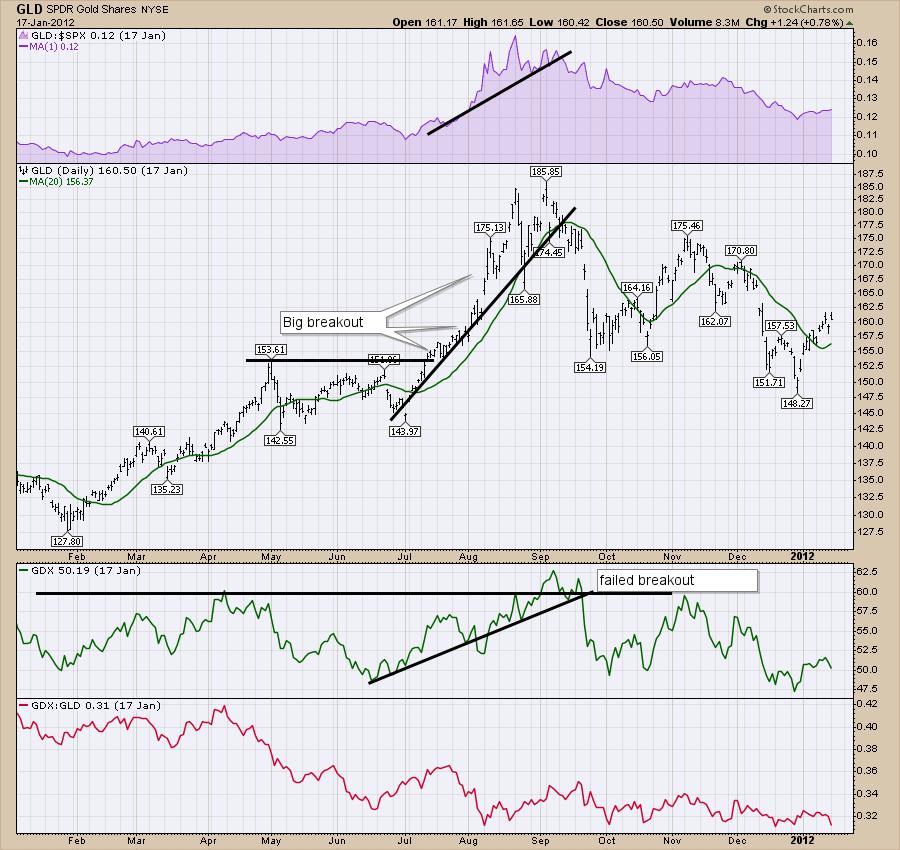
On the chart below, I compare the GLD chart with the GDX chart back at Gold's final high in 2011. We see the same conditions here, as Gold broke out above a consolidation and kept going. The gold miners (third panel) tried to break out right as Gold topped out and failed. Gold also broke a relative strength uptrend versus the $SPX; all three occurred within a few days of each other.
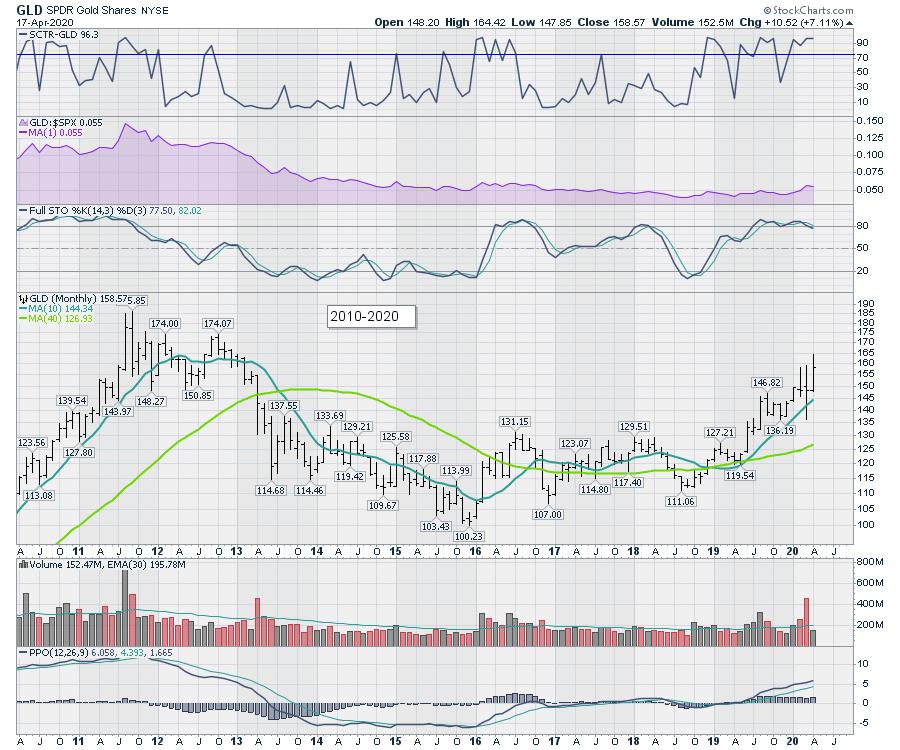
Here is how Gold topped out on the monthly chart compared to 2011.
All the setups are there. Watch closely to make sure the gold miners follow Gold higher and hold the breakout. If not, keep your eyes peeled for an exit!
Good trading,
Greg Schnell, CMT, MFTA
Senior Technical Analyst, StockCharts.com
Author, Stock Charts For Dummies
Want to stay on top of the market's latest intermarket signals?
– Follow @SchnellInvestor on Twitter
– Connect with Greg on LinkedIn
– Subscribe to The Canadian Technician
– Email at info@gregschnell.com
