Major U.S. stock indexes continue to probe for a short-term bottom. The daily bars in Chart 1 show the S&P 500 regaining some lost ground over the last two weeks after falling to the lowest level in three years. But there's still a lot of overhead resistance to deal with. The SPX remains well below its red 200-day average. And its blue 50-day average has just slipped below its red 200-day line. In addition, the flat red trendlines overlaid on the price bars show the SPX meeting some selling at its 38% Fibonacci retracement line. That's usually the first line of resistance after a market selloff. The 14-day RSI line in the upper box also remains below potential resistance at its midpoint line at 50. Longer-range charts also remain a big concern.
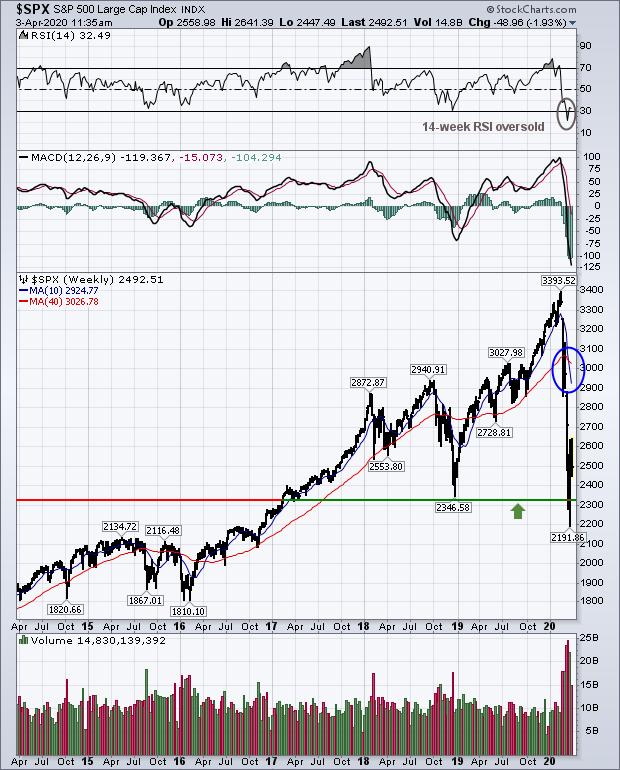
When studying major market trends, longer-range charts are usually more important than daily charts. That's because the longer-range charts are better at determining the major direction of stock prices. And right now those longer-range charts aren't very encouraging. Chart 2 plots a weekly chart of the S&P 500 over the last six years. There's some good and bad news on the chart. The 14-week RSI line in the upper box is deeply oversold. In addition, the SPX has managed to climb back above broken support formed near the end of 2018 (green trendline). While that's mildly encouraging, it's not enough to restore the potential technical damage done during March to the market's long-term uptrend. In addition, its weekly MACD lines (middle box) remain in a steep downtrend. And the blue circle shows its 10-week average falling below its red 40-week line for the first time in more than a year. All of which suggests there's a lot more healing that needs to be done for stocks to regain upward momentum.
Chart 1
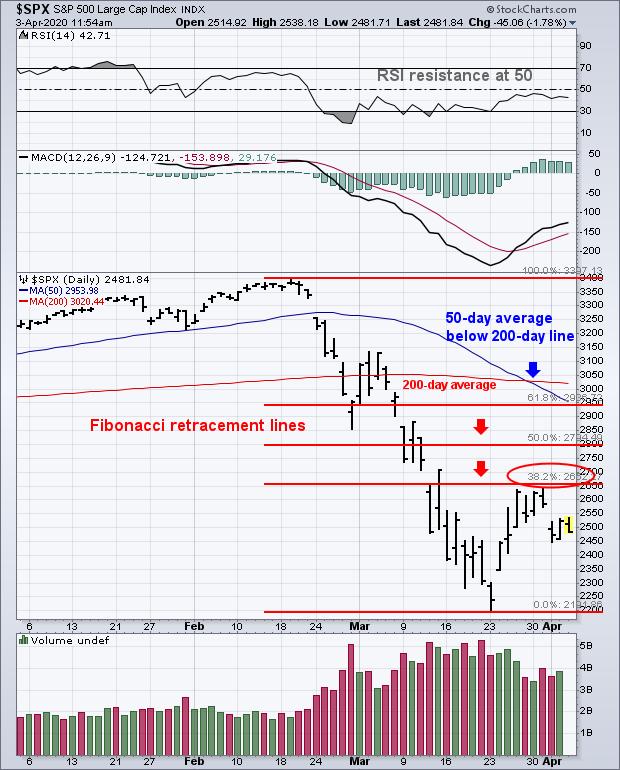
Chart 2
Editor's Note: This is an excerpt of an article that was originally published in John Murphy's Market Message on Friday, April 3rd at 11:15am ET. Click here to read the full article, which includes Chart 3 and an analysis of the SPX monthly chart.