It seems odd that the best company in the COVID-19 backdrop gets crushed after earnings. AMZN is down $200 after their earnings announcement. It is still a great company, but that is a vicious reversal. Currently, it is giving back 40% of the breakout.
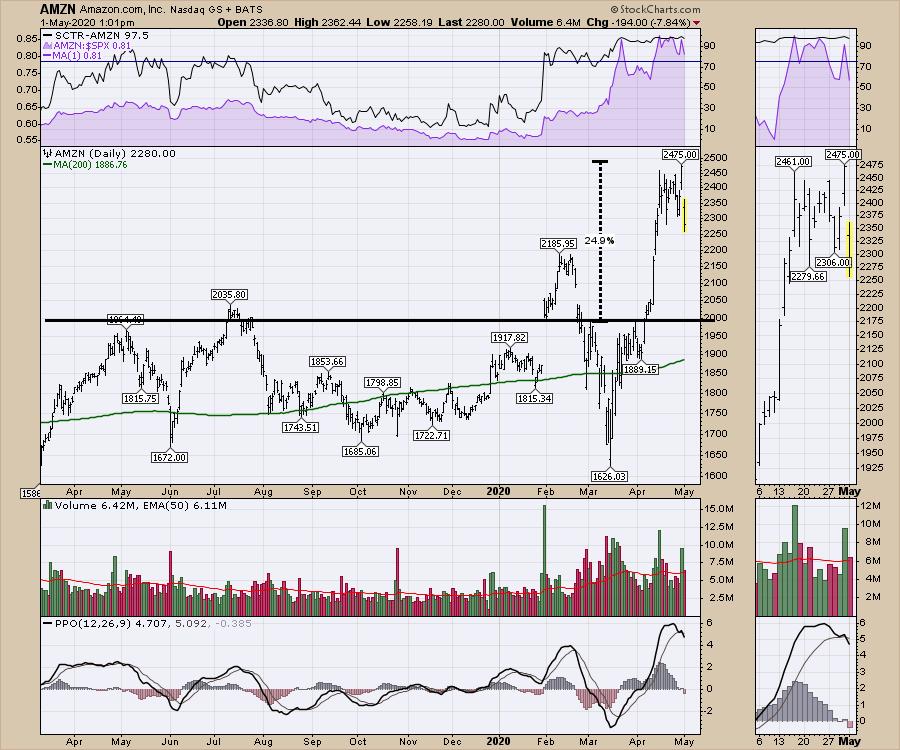
As I am continually amazed by the strength of the bear market rally, its purpose is to get everyone flipped to bullish while within the downtrend. If it is not a bear market rally, but the start of the next bull market, those who traded this off the lows will have done very well. Others will just be getting onboard as it starts to look like the bull is back in play.
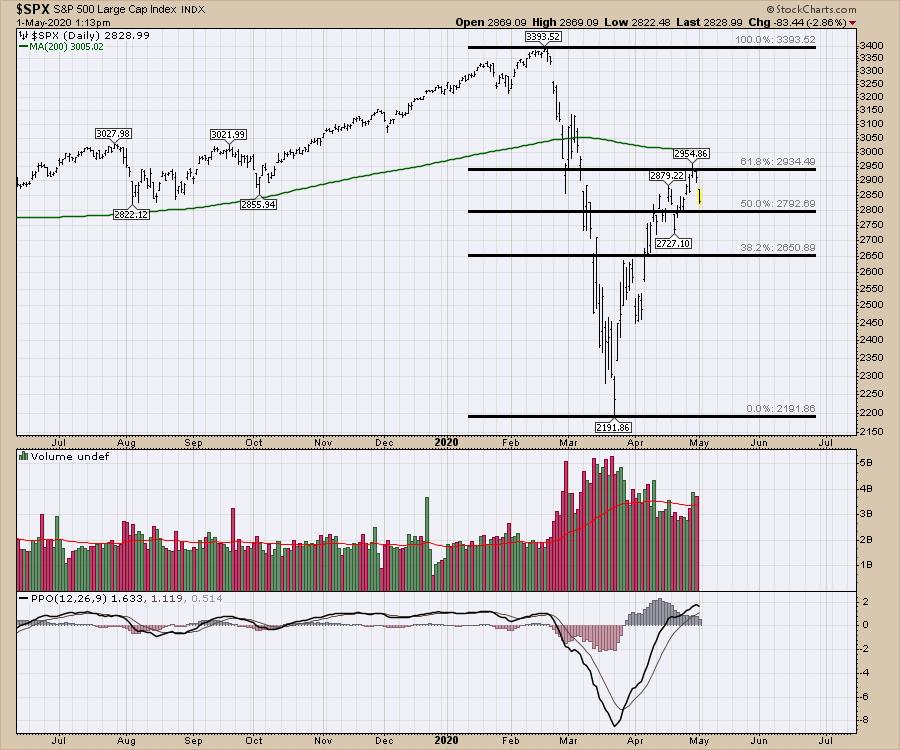
There are some friction points on the $SPX and I want to discuss those. The two key resistance points are starting to come into play. While there are many who are keen Fibonacci retracement followers, I am not that active using fib's. I have been expecting the lower level (50%) to be the retracement levels to watch out for. While the market kept pushing higher, the $SPX has tagged the 61.8% retracement and we are seeing a quick decline. The second major hurdle is the 200 DMA just above at the 3000 level. Now that the 200-day moving average is down-sloping, this is a very important resistance. Both of these are so close together as to make it a strong resistance level.
With the accelerating volume recently (three days), it does make you wonder what changed. It might appear the big boys are starting to reposition for the downside and selling into the rally as the tech names reported.
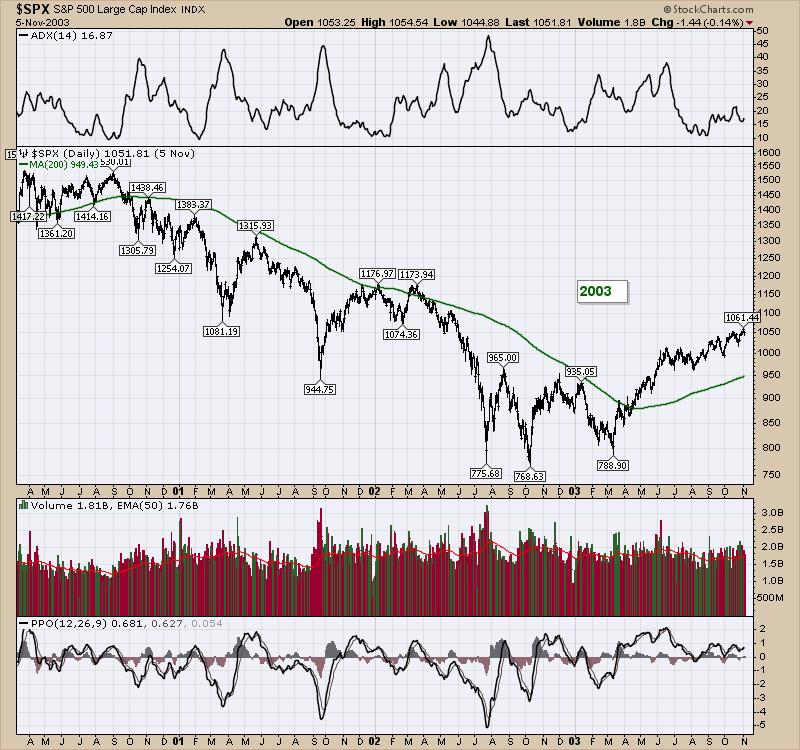
We have great examples from the big pullbacks in the 2000-2003 and 2007-2009 bear markets. The 200-day moving averages are shown in green. In the 2000-2003 pullback, the 200-day moving average was an important level of resistance to be aware of. In late 2001-early 2002, there were three occasions where you would be wondering if the market was going on to higher highs. Two of those were off the original 9/11 drop. But notice the intensity of the bear moves. They rarely paused to give you time to reassess the situation. They will trade wildly, with vicious volatility, when trapped below the 200-DMA. I have not drawn a line, but notice the 1400 level, which was the lower 1/3 of the price action through most of 2000. The 1438 high, as well as the 1383 high, were tests of that range and coincided with the 200-DMA close by.
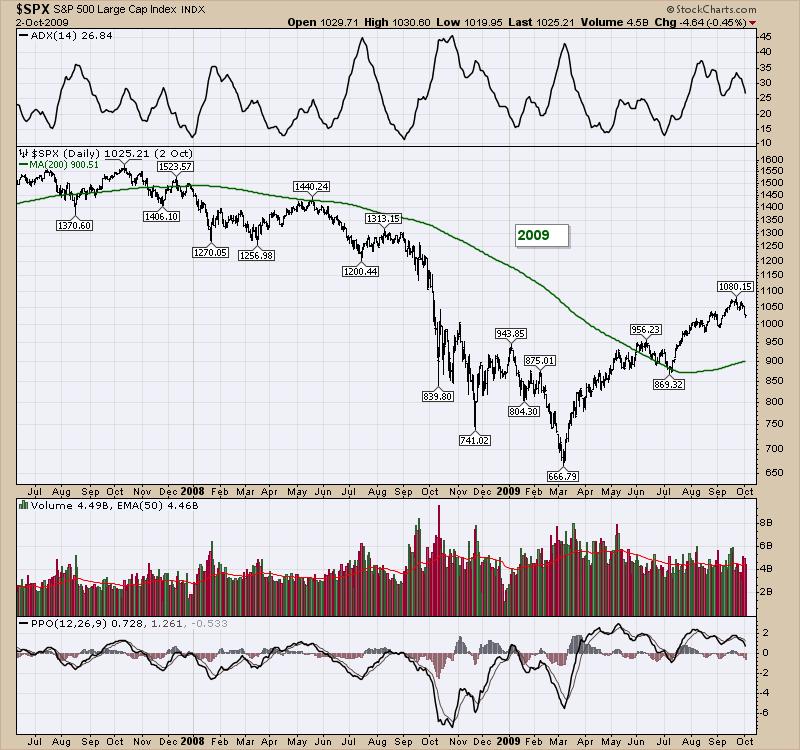
Below is the picture for 2007-2009. The 200-DMA was a good resistance line for many months. Notice the difficulty in 2009 as it finally cleared it, but walked lower with it for a full month before reversing to the upside.
Once again, notice the 1400 level. It was a support resistance line of the action in 2007, but still ended up being a textbook place to expect price to fail when price met the 200-DMA there in May 2008. The May to July 2008 move was particularly harsh, with lots of overlapping price action, but walking lower.
Now we have reached the 200-DMA again on the 2020 chart shown below. The friction levels of 2950 and 2800 are important levels to focus on now, due to the similar pattern in the 2019 price action to that which we saw in 2000 and 2007 above.
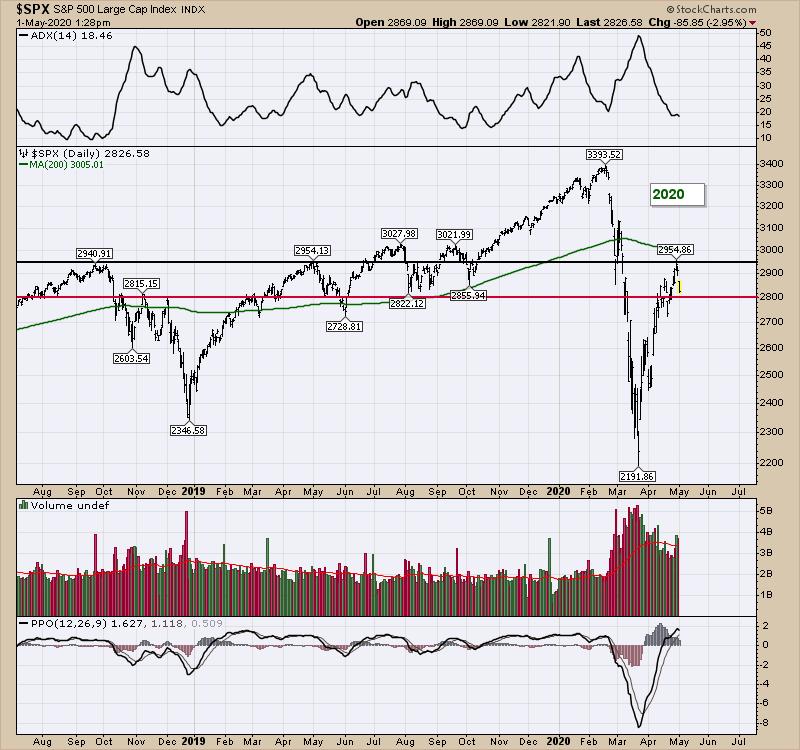
If 2800 fails to hold, it will be a rocky walk south until some support starts to show up. For me, it means either trade carefully or, alternatively, sit back and let others, namely institutions, find the base.
Good trading,
Greg Schnell, CMT, MFTA
Senior Technical Analyst, StockCharts.com
Author, Stock Charts For Dummies
Want to stay on top of the market's latest intermarket signals?
– Follow @SchnellInvestor on Twitter
– Connect with Greg on LinkedIn
– Subscribe to The Canadian Technician
– Email at info@gregschnell.com
