The Stock Market is Forecasting Higher Commodity Prices
[One big] thing going positive for commodities is my Inflation/Deflation ratio. This series pits equities sensitive to swings in commodity prices, such as natural resource stocks, to those that do better when interest rates are falling, such as utilities, consumer staples, etc. The arrows show that this stock market relationship has a good track record of forecasting major turning points for commodities. Consequently, its recent sharp rally is a strong omen in favor of forthcoming strength in the commodity pits - but what of commodities themselves?
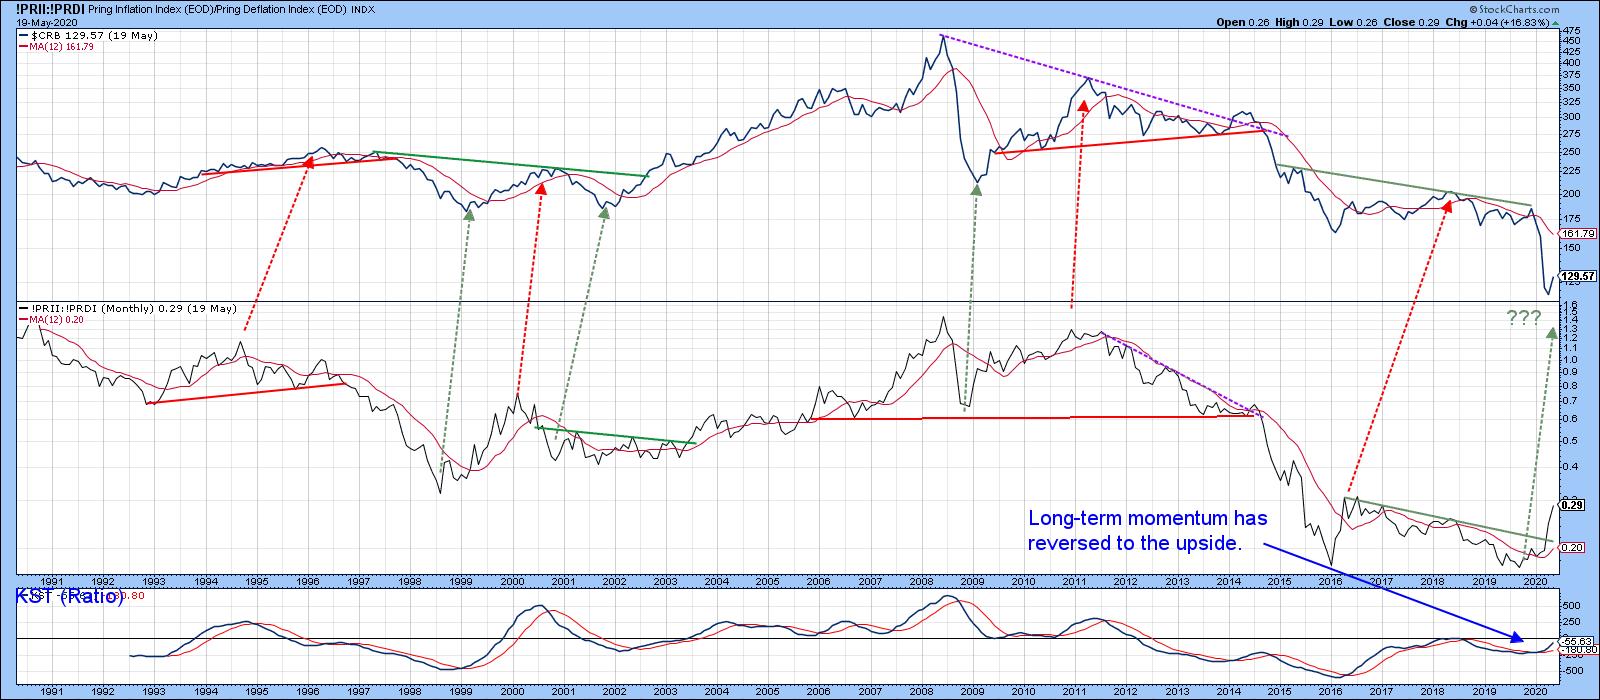 Chart 3
Commodities on the Verge of a Breakout
Chart 4 reveals the very long-term technical position, where we can see a break below the red support trendline. There are many ways that the line could be constructed, but they would all have been violated. The one drawn in the chart makes sense, because it touches or approaches six declines and, importantly, intersects with the 12-month MA. It therefore represents a very significant barrier (resistance) to upside progress. There is obviously a lot to reverse here, so when I talk about a commodity rally, I am referring to a move that attempts to regain lost ground following the breakdown point at around 160, rather than something more ambitious.
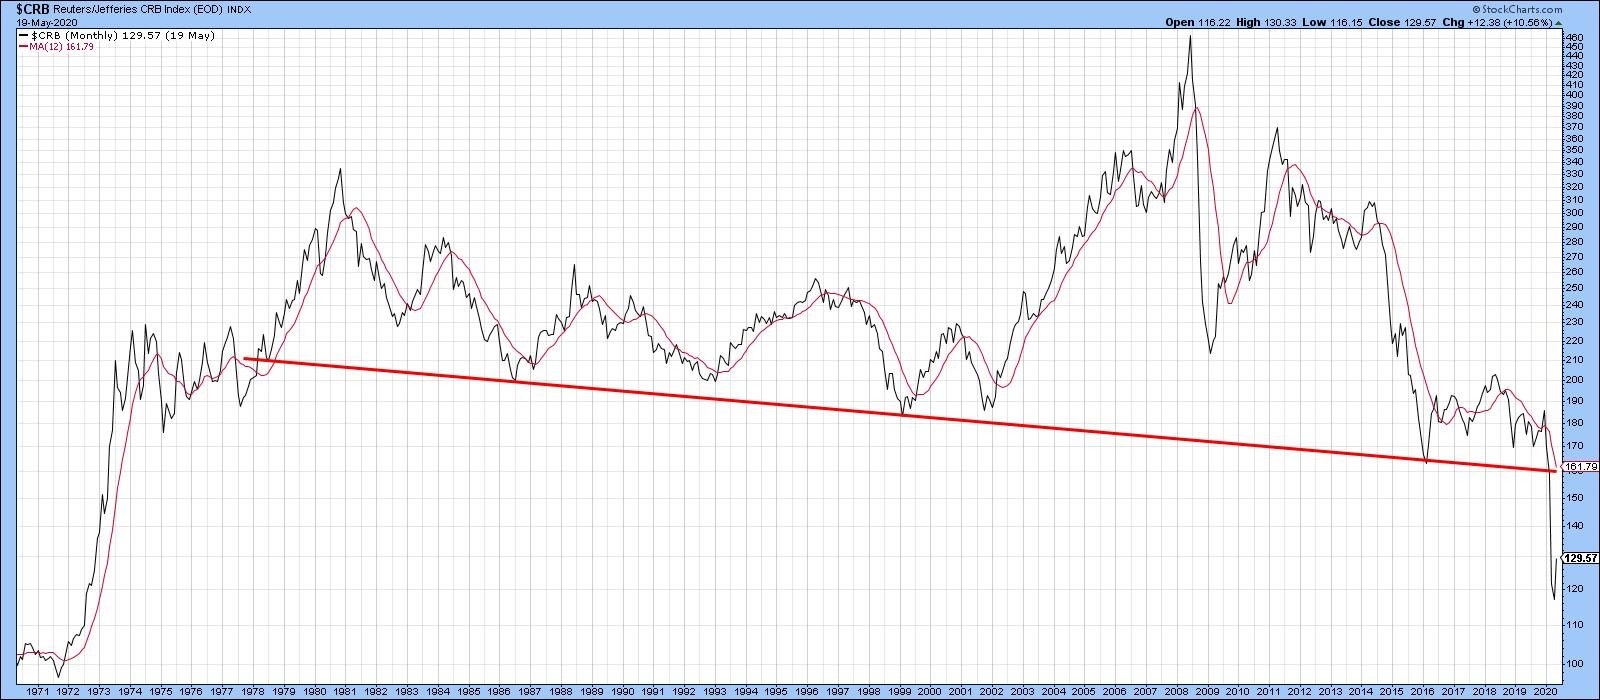 Chart 4
The starting point is Chart 5, which indicates that the Index is in the process of breaking above the horizontal resistance trendline. A breakout is a breakout, but the chart looks as though some additional re-accumulation may be required, as a right shoulder completion would result in a stronger foundation from which a rally could be launched. Also, gaps are usually closed and there is a noticeable one that developed between Friday and Monday.
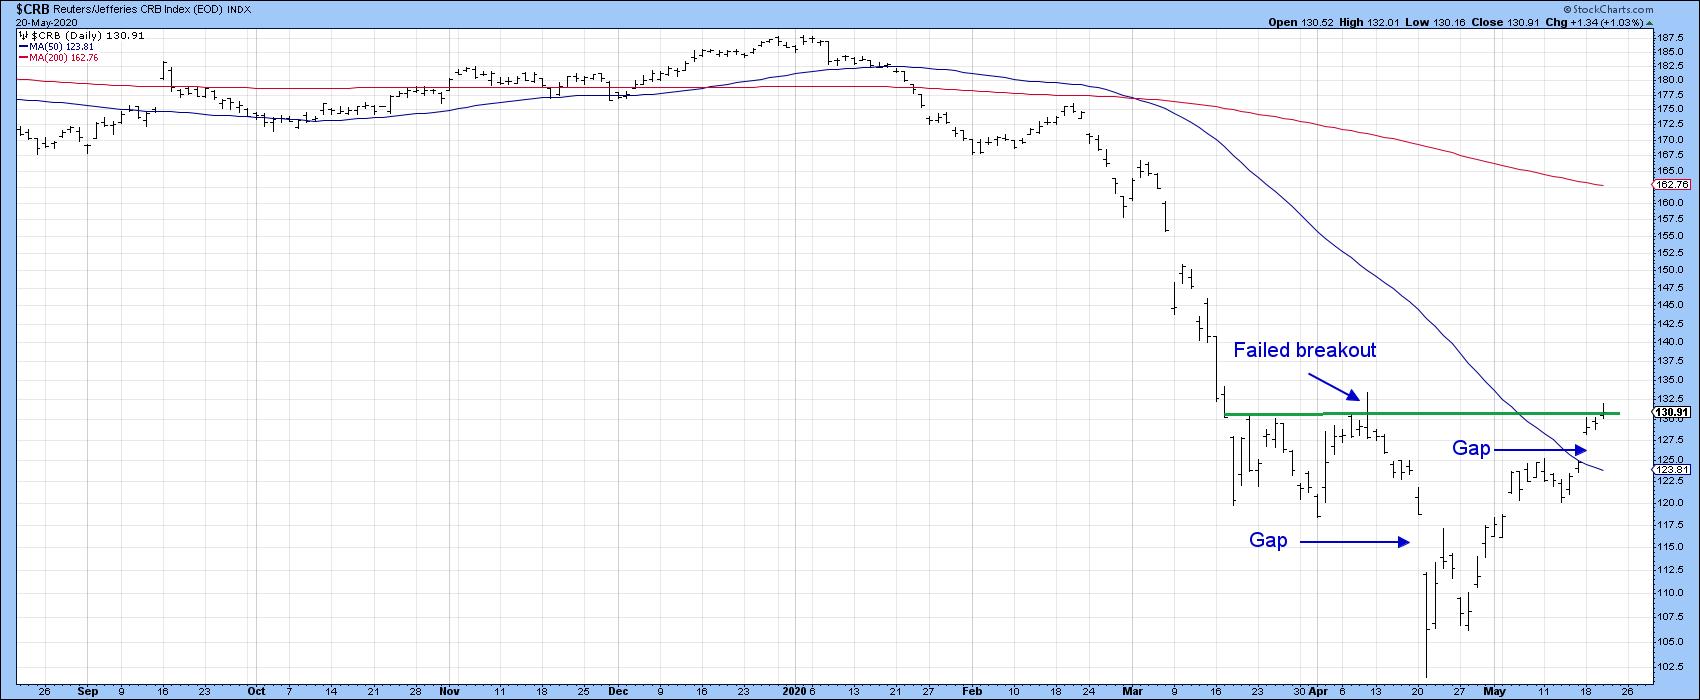 Chart 5
We see the same thing in Chart 6, featuring the DB Commodity ETF (DBC) and the Bloomberg Commodity ETN (DJP).
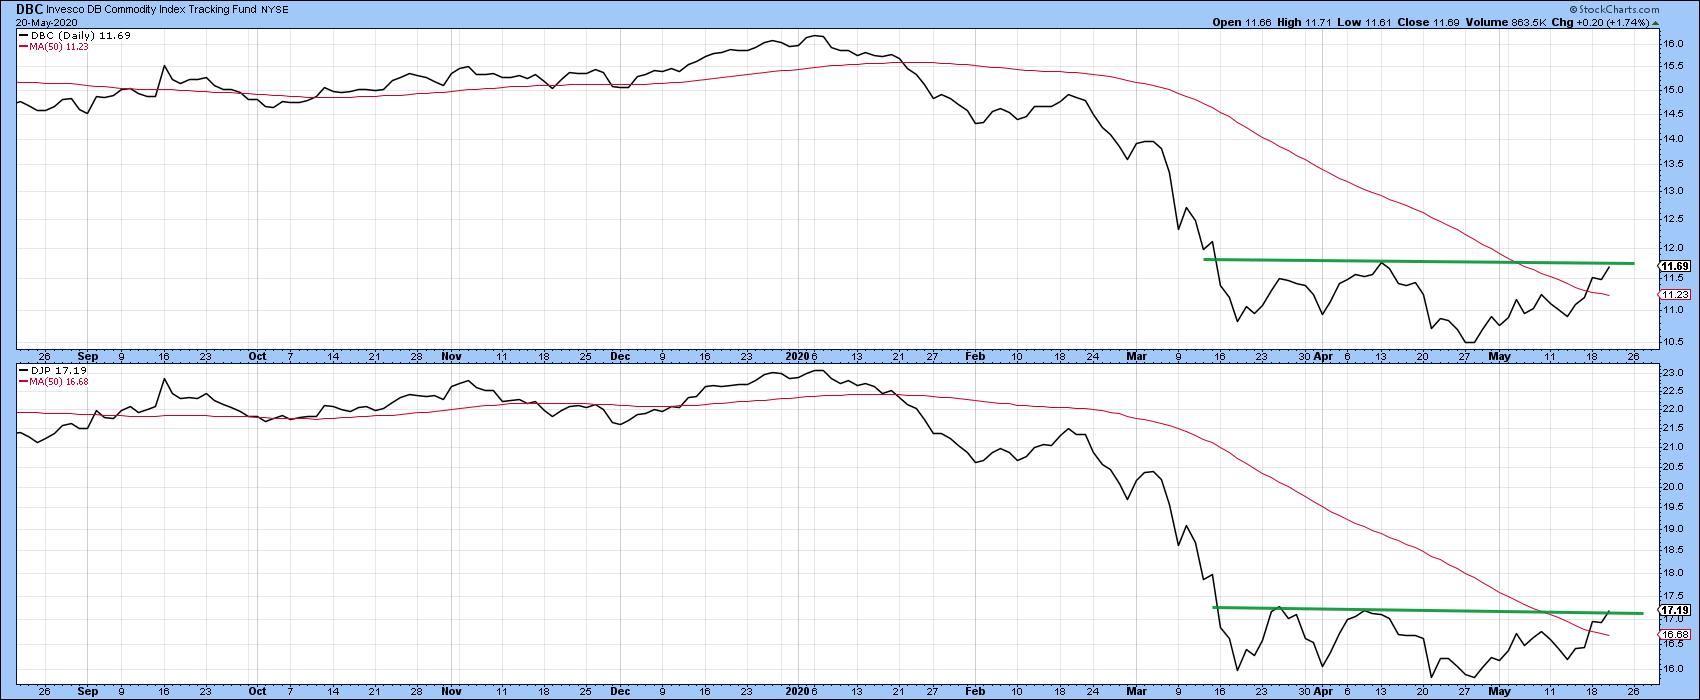 Chart 6
Three important commodity sub-components, the DB Energy (DBE), DB Base Metals (DBB) and Agriculture (DBA) are plotted in Chart 7, where three more potential bases are revealed. Base metals are worth watching because they appear to be the first that are emerging from their recent trading range, and, therefore, leading the way.
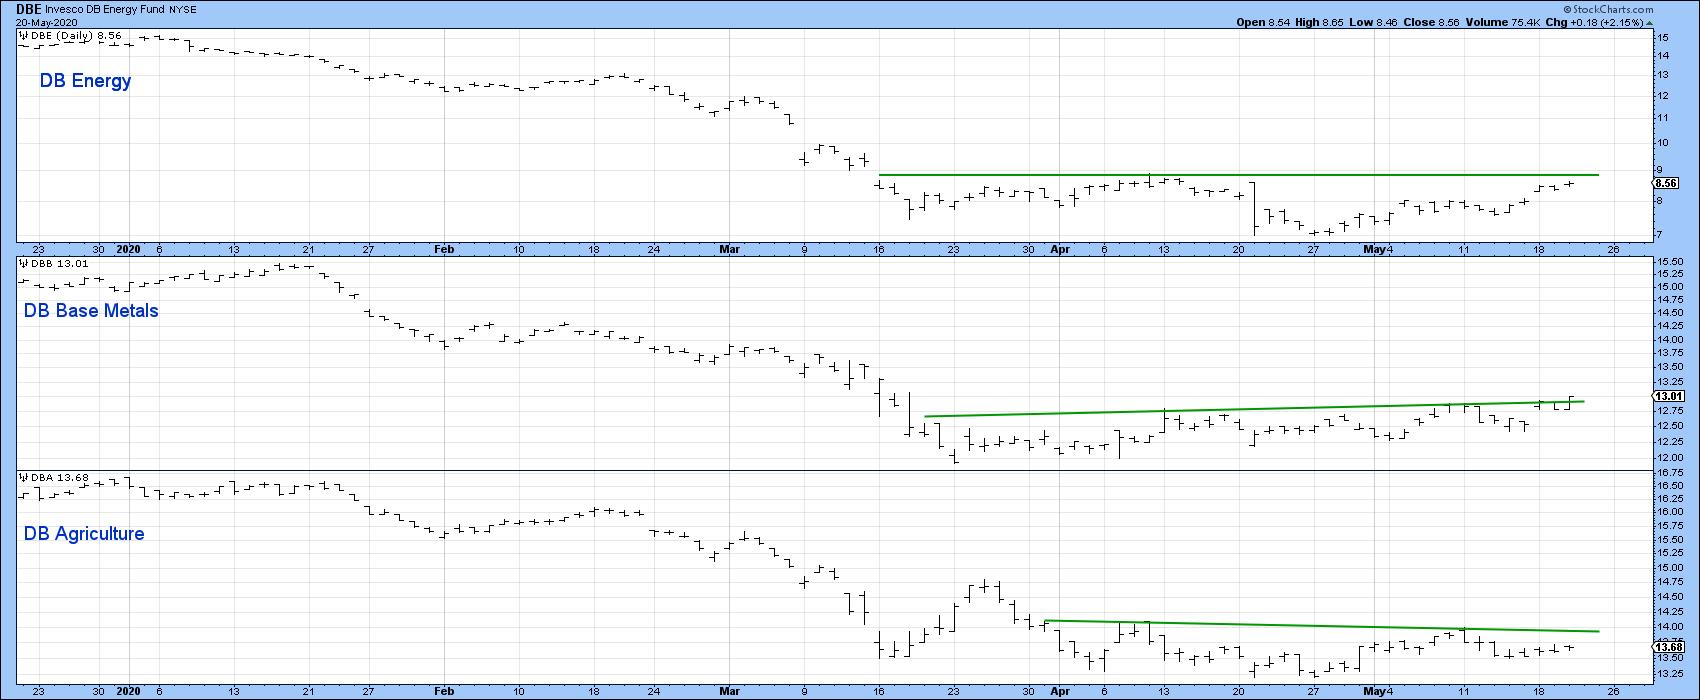 Chart 7
Editor's Note: This is an excerpt of an article that was originally published in Martin Pring's Market Roundup on Thursday, May 21st at 12:15pm ET. Click here to read the full article, which includes Charts 1-2 and 8 plus a discussion of Gold and the Oil VIX.
Good luck and good charting,
Martin J. Pring
The views expressed in this article are those of the author and do not necessarily reflect the position or opinion of Pring Turner Capital Group of Walnut Creek or its affiliates.
