The S&P 500 closed at an all-time high on February 19, 2020 when it reached 3386.15. At its Friday close of 2929.80, the benchmark index remained 456.35 points, or 13.48%, shy of that high. February 19th was also the date that I announced our latest portfolio stocks. I use the 19th calendar day of February, May, August and November to "restock" the portfolios with companies that (1) have beaten Wall Street consensus estimates as to both revenues and EPS, (2) are liquid (average volume of at least 200,000 shares per day) and (3) show relative strength vs. their industry peers and the S&P 500. It helps if those industry groups are strong as well.
How Has The Model Portfolio Performed?
Well, using the User-Defined Index here at StockCharts.com, I've tracked the performance since its inception on November 19, 2018, with the comparative chart of the S&P 500 below it:
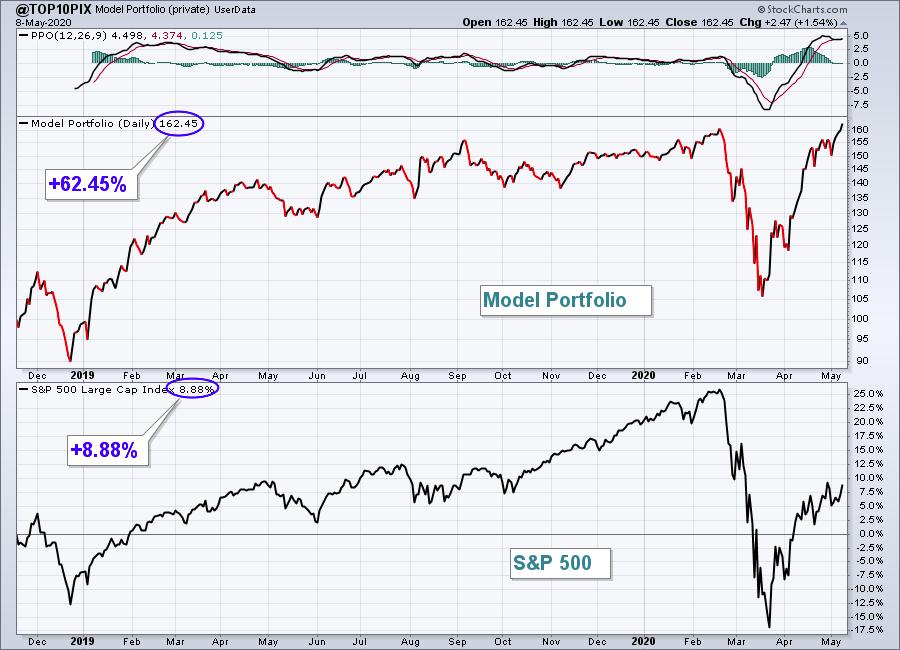
In addition to clearing its February top on Friday, it has now gained an astounding 62.45% in 18 months, while the benchmark S&P 500 has gained 8.88% over that same timeframe. That's more than 53 percentage points better. It's widely published that 80% of mutual funds do not beat the S&P 500. We've beaten it 7-fold! To say I'm proud of this performance would be a huge understatement.
How It All Began
I remember when I first created my initial "Strong Earnings ChartList" in 2013. It became so popular with our members that we ended up changing our name from Invested Central to EarningsBeats.com. As a former practicing CPA, who worked in public accounting for 20 years, the idea of wanting to own only companies where management was executing its business plan just made perfect sense to me. I remember seeing companies that would miss estimates get absolutely pummeled by Wall Street. In many of those cases, it took months, even years, for Wall Street to completely forgive these companies for their sins. So I wondered whether trading only companies beating quarterly estimates would make sense and provide the framework for our revised business model. Boy did it ever!
From 2013 through February 2020, I'd estimate that more than 99% of my personal trades came from this Strong Earnings ChartList. It was constantly updated as earnings reports were released, always providing the "best of the best" in terms of earnings reports. That, along with excellent relative strength, is what landed companies on this ChartList. Because this ChartList was comprised of anywhere from 100-350 companies at any given point in time, members kept asking, "What are your FAVORITE stocks on this list? It's hard to narrow down the list from 300 to a manageable number."
The Model Portfolio was born!
What Is The Model Portfolio?
While I wasn't looking for diversification in the sense that all sectors needed to be represented, I was looking to diversify into 10 equal-weighted stocks from 10 different industry groups - preferably leading industry groups. I have found through the years that owning the best relative strength stocks in the best relative strength industry groups is a winning combination. I began providing my Top 10 Stocks on November 19, 2018; here are the quarterly performance results since that time (Model portfolio vs. S&P 500):
- November 19, 2018 - February 19, 2019: +25.67% vs. +3.31%
- February 19, 2019 - May 19, 2019: +3.55% vs. +2.87%
- May 19, 2019 - August 19, 2019: +13.83% vs. +2.24%
- August 19, 2019 - November 19, 2019: -0.67% vs. +6.72%
- November 19, 2019 - February 19, 2020: +9.07% vs. +8.52%
- February 19, 2020 - May 8, 2020 (11 days remain to end of quarter): +1.21% vs. -13.48%
The concept is simple. You own 10 of the best stocks in the U.S. market for three months. Then you replace them with 10 of the best stocks at that time for another 9o days. Rinse and repeat every quarter. It's simply been my way of saying, "these are my favorite 10 stocks (from 10 different industry groups) on the Strong Earnings ChartList." On May 19th, I'll unveil my favorite 10 stocks for next quarter to once again try to beat the S&P 500. Of the 6 quarters since November 2018, the Model portfolio has outperformed 5 out of 6 quarters. That's quite a track record! If you'd like to ensure a spot for the May 19th Top 10 Stocks webinar for EarningsBeats.com members, you can sign up for a fully refundable $7 30-day trial HERE.
What Stocks Have Contributed to This Quarter's Success?
The first amazing stat is that all 10 stocks of the Model Portfolio are currently beating the S&P 500 this quarter. But three have stood out above all the rest. The first is Shopify (SHOP):
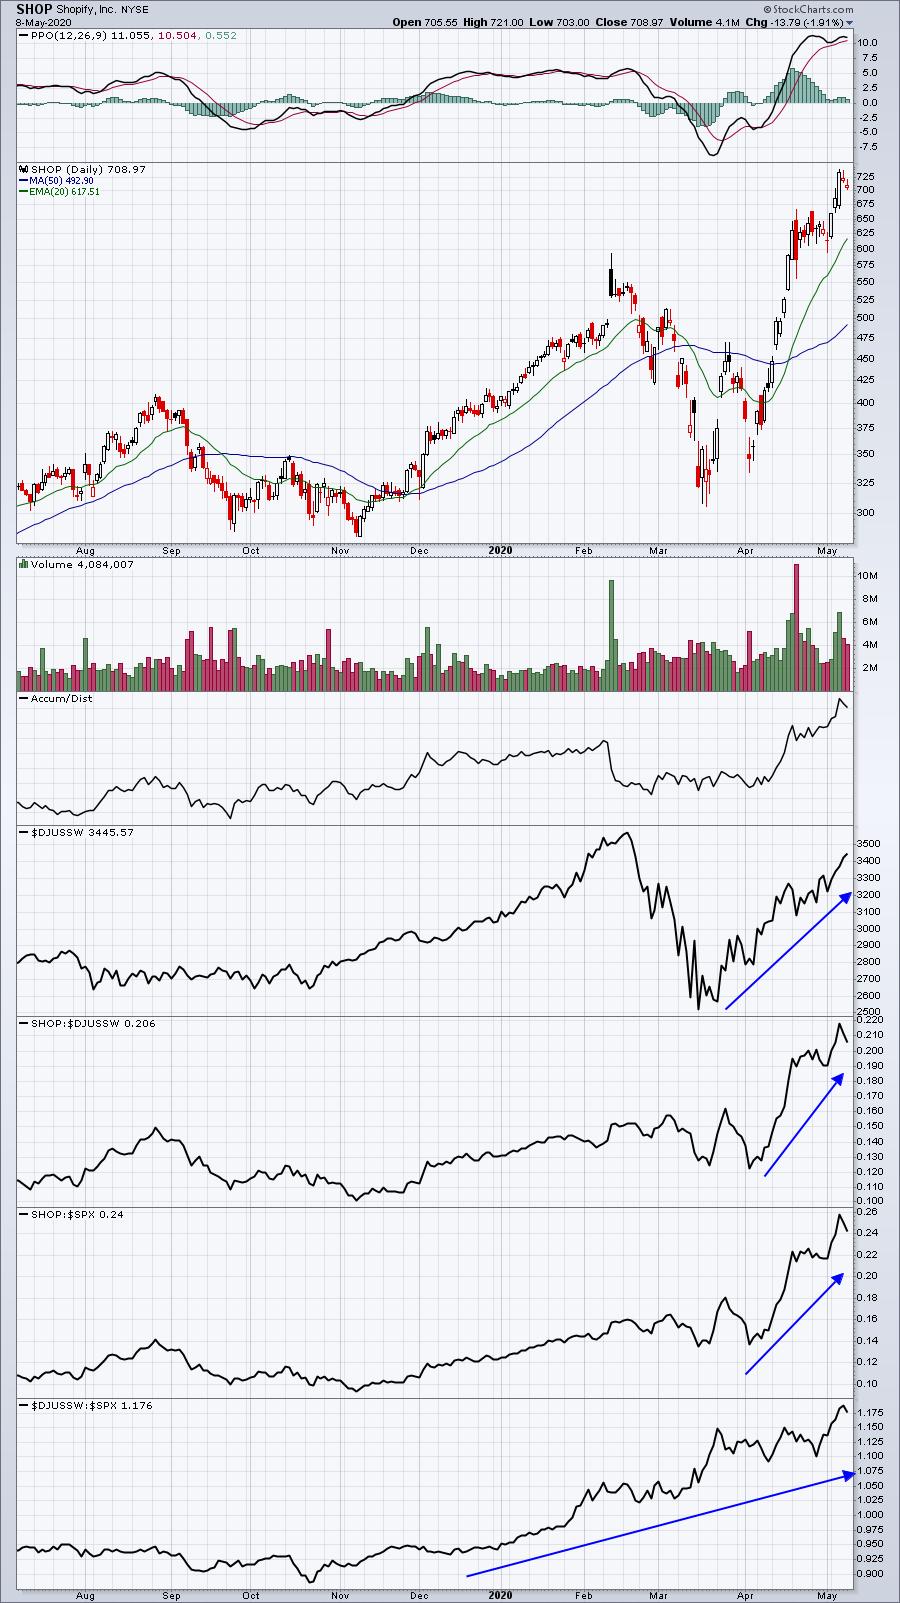
SHOP is exactly what I look for. It's part of one of the best industry groups of the last several years - software ($DJUSSW). It's also a leading software stock, up more than 30% since February 19th. The other two leading stocks for this portfolio have been Amazon.com (AMZN) and Vertex Pharmaceuticals (VRTX), both higher by 9.6% this quarter. Last week, the S&P 500 rose by 3.50%. The Model portfolio gained 8.08% and here are all the stocks in the portfolio and their gains last week:
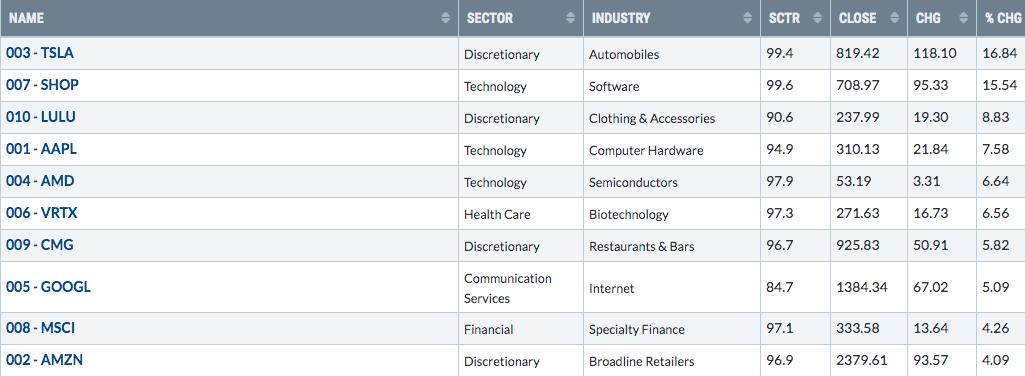
That's how you crush an index! Every stock gained more than the benchmark S&P 500.
Join Me On Saturday - For FREE
I also would like to invite everyone at StockCharts.com to join me for a very special and free event on Saturday, May 9th at 2pm EST. I've been asked numerous times, "What are your favorite features at StockCharts?" I always answer (1) ChartLists and (2) the Scan Engine. Grayson Roze, VP of Operations, and Bill Shelby, Lead Software Engineer, are two experts from StockCharts on those two subjects who will be joining me for this event tomorrow. You can see the agenda by CLICKING HERE. It will be very educational and provide solid tips to improve your trading results. As a final incentive, we will have drawings throughout the event for free EarningsBeats.com memberships - but you must be present for the LIVE event to be eligible. If you can't make the event LIVE, no worries; we're recording it and will be happy to send you a copy. But you still must follow the link above and be sure to sign up for our free newsletter.
Happy trading!
Tom
