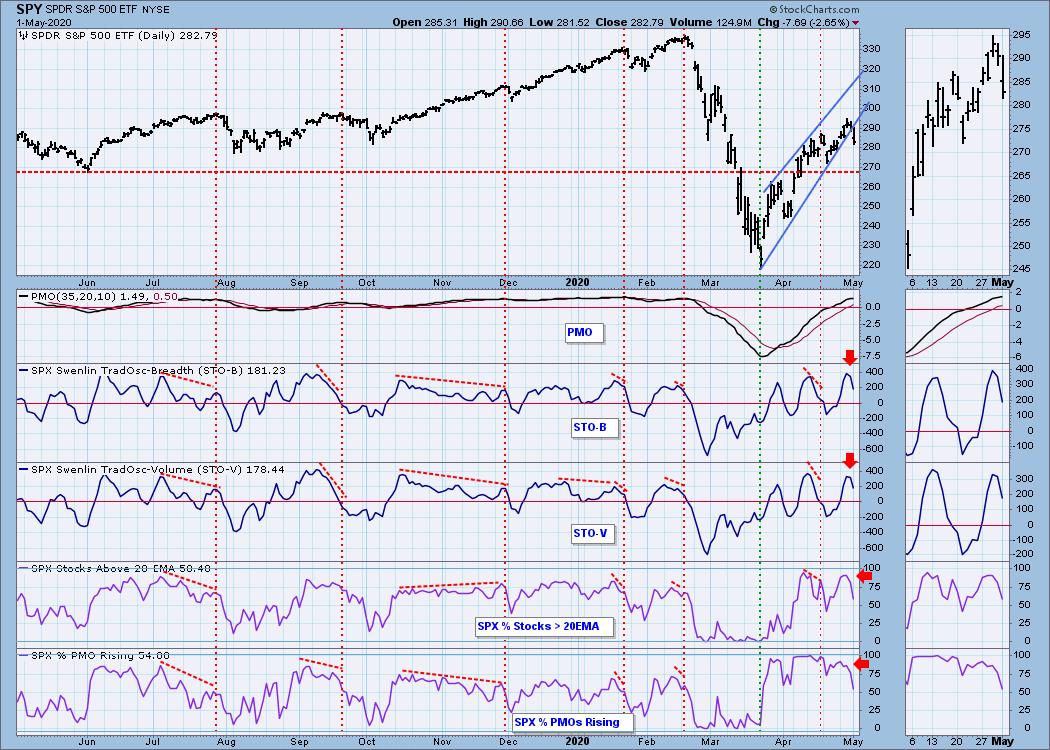
Yet again, the Swenlin Trading Oscillators gave our readers early warning for today's decline. I have written about their previous successes in ChartWatchers, but I wanted to report back to you that they are continuing to be leading indicators. Below is an excerpt from yesterday's DecisionPoint Alert with updated charts and added new commentary in italics:
Short-Term Market Indicators: The ST trend is UP and the market condition is OVERBOUGHT based upon the Swenlin Trading Oscillator (STO) readings. The STOs topped today, which generally is the main ingredient in the recipe for a short-term decline. How much of a decline? I believe worst case is the 270 level on the SPY. I've updated the chart to include today's action. We now have a breakdown from the bearish rising wedge. You can see that the %stocks > 20/50-EMAs had also begun to deteriorate before the market. I still am looking for support to hold at 270 for the SPY.

As investors, we want to accomplish two basic things: (1) Determine the trend and condition of the market and (2) select stocks that will ride that tide. The DecisionPoint Alert helps with the first step, and DecisionPoint Diamonds helps with the second. Go to DecisionPoint.com and SUBSCRIBE TODAY! (Charter Subscriber Discounts Available!)
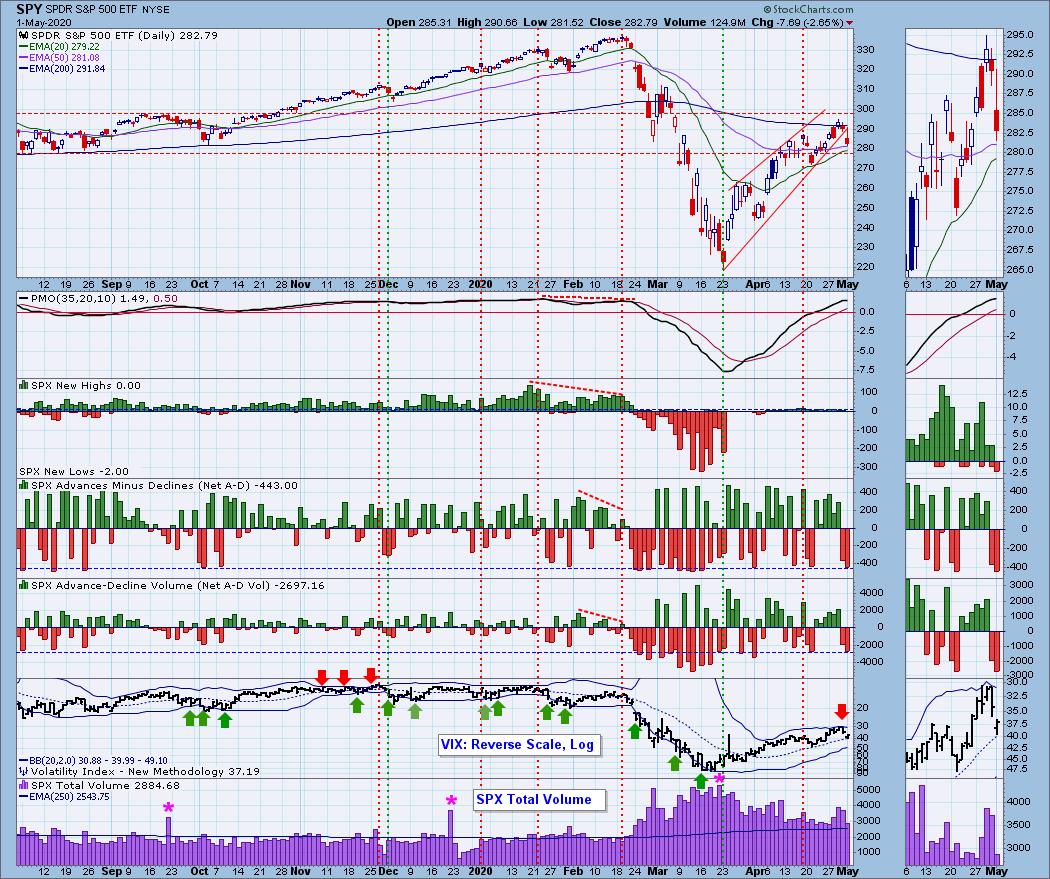
Climactic Market Indicators: Today, we saw negative climactic readings. Combine these with the VIX and I have to say we are looking at a selling initiation. We should expect lower prices going into tomorrow. These indicators had even more climactic negative readings today, which suggests further decline.
Live Trading Room - Tuesdays/Thursdays
I'm teaming up with Mary Ellen McGonagle (MEMInvestmentResearch.com) to do regular "LIVE Trading Room" sessions for FREE at 11:00am ET. We've had excellent reviews on our new LIVE Trading Rooms so far and plan on continuing them Tuesdays/Thursdays 11:00am ET. The link will be sent out the day before the event, so watch your email and tell your colleagues to sign up for our free email list on DecisionPoint.com to be notified!
Conclusion: I'm finding our indicators exceedingly helpful, especially when paired with the DecisionPoint Analysis Process. To finish off today's article, I'll give you my "Diamond" of the week from the DP Diamonds Report. I present 60 stocks each month for just $25! While they are "diamonds in the rough" and provide no guarantee of success, I've been culling from the Diamonds Reports for my own investments and have had success through this tough time.
If you'd like a trial to our website newsletters, contact support@decisionpoint.com and we will hook you up!
Happy Charting! - Erin
Diamond of the Week (from Monday 4/27 DP Diamonds Report):
Below are the original article and charts. Underneath each chart, I've included the updated chart for today.
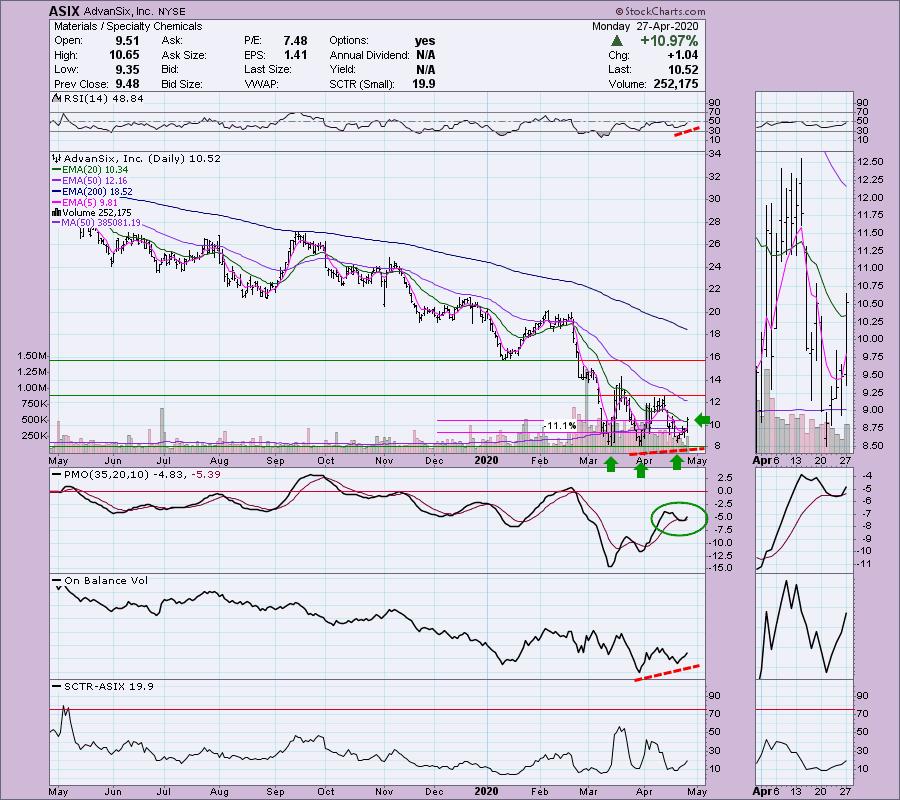
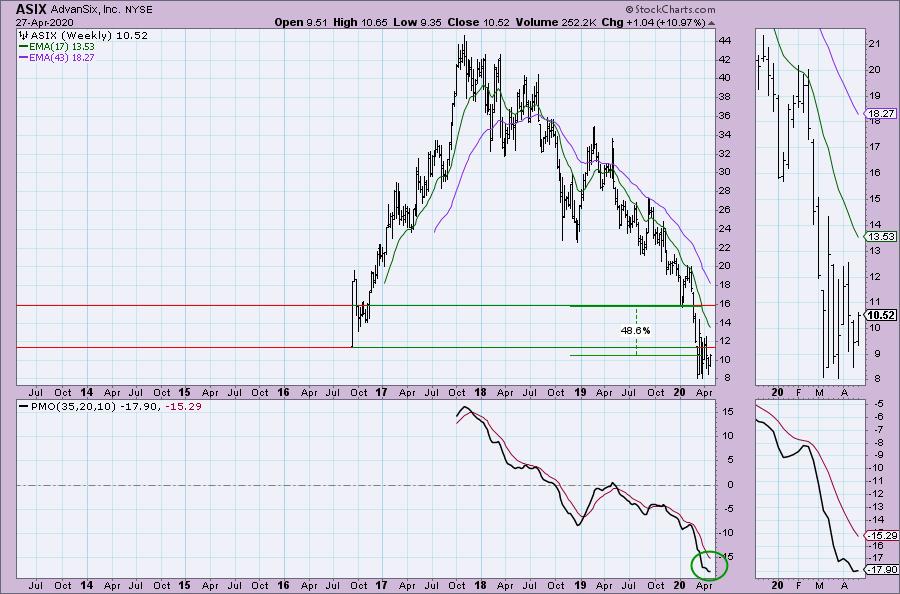
AdvanSix Inc (ASIX) - Earnings: 5/1/2020 (BMO)
The double-bottom pattern never executed, but this actually has set-up a possible triple-bottom. This one reports earnings on Friday and, with a near 11% move to the upside, it may require some patience. Setting a stop is a bit tricky in terms of finding support, so I just listed an 11% stop area based on today's move. The RSI isn't quite in positive territory above 50, but it is trending higher. The OBV bottoms are very positive given comparative price bottoms are mostly flat.
Chart from 4/27:
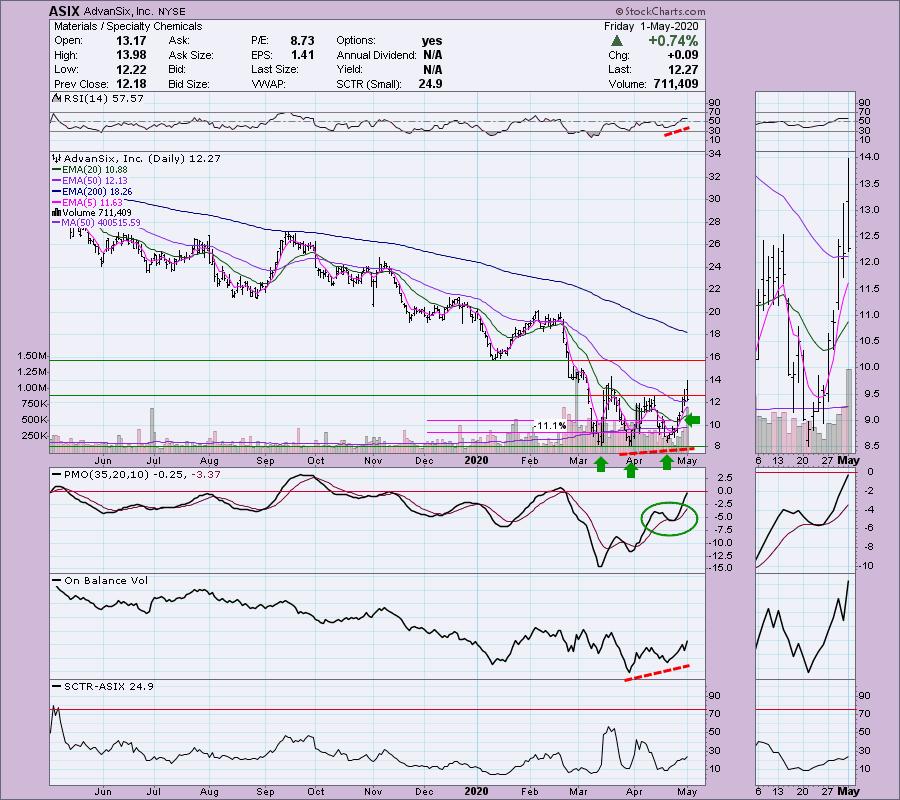
Daily Chart from Friday 5/1:
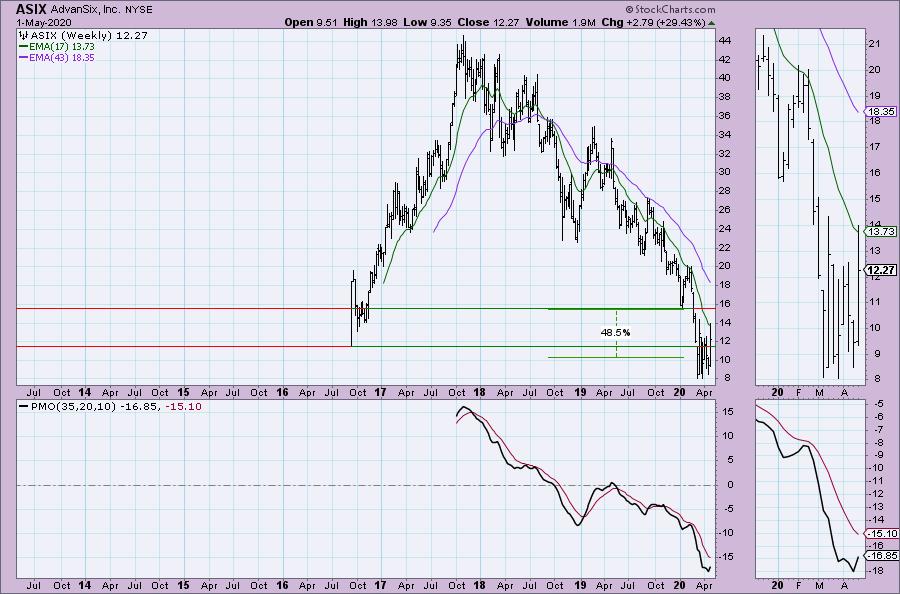
While upside potential is amazing here, the stock is trading below its IPO. That could be stiff overhead resistance. The weekly PMO is turning up (although I note it did the same thing in late March on the failed rally). Just be careful here, I recommend position sizing to protect yourself.
Weekly chart from 4/27:
Weekly chart from Friday (5/1):
Technical Analysis is a windsock, not a crystal ball.
Helpful DecisionPoint Links:
DecisionPoint Alert Chart List
DecisionPoint Golden Cross/Silver Cross Index Chart List
DecisionPoint Sector Chart List
Price Momentum Oscillator (PMO)
Swenlin Trading Oscillators (STO-B and STO-V)
