
Anyone who has followed the market like I have through every possible scenario, from the dot-com bubble to 9/11 to the Great Recession to what we've seen the past few days, should have recognized that the market was getting VERY extended. When you start seeing Stochastics near 100 with RSI's 80+ on tons of individual stocks as well as in the major indexes, alongside the VIX starting to move higher in unison with the market, you're likely to see the type of selling we saw this past week. Add to the massively overbought conditions the fact that many "new" investors and traders have only seen the market go higher for months now with many of them only trading options as a "cheaper" alternative, and it becomes a recipe for a sizable pullback.
There is some good news. Once a big batch of traders have thrown up their hands in unison and surrendered, once the margin calls run their course and once the market goes from being extremely overbought to oversold, stocks start to look more attractive. And this is particularly true for those companies who posted great earnings numbers, especially those that guided higher for the future. How long the current selling lasts is anyone's guess, but, as you can see in the chart below, the NASDAQ has mostly managed to hold above its 20- and 50-day moving averages - and there's only been a handful of times when it's fallen meaningfully below its 200-day moving average during the past 10 years. This past week, the first key line of defense was the 50-day, currently at 10,858 (tested Friday) with the "biggie" being the 200-day, currently at 9,371, which is 13% below the 50-day.
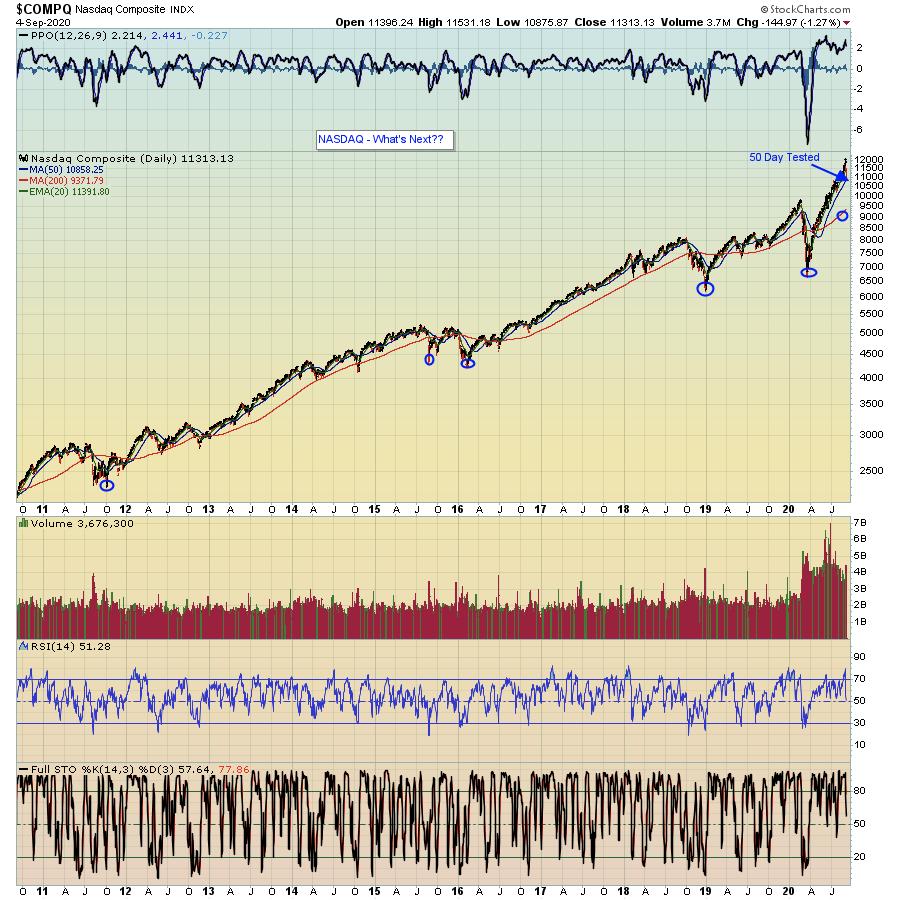
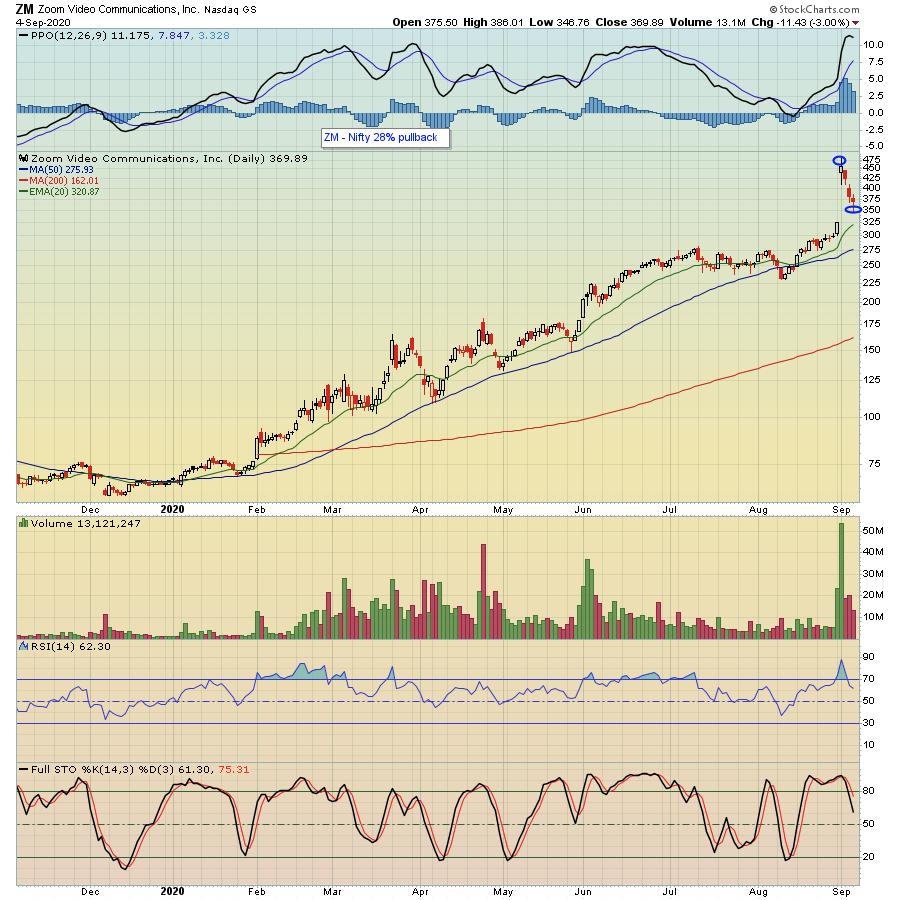
There's certainly nothing wrong with a market correction, but it often takes many traders by surprise when they see the market correct 10% - like the NASDAQ just did from Wednesday's top to Friday's bottom - over the course of just a few days. And that 10% correction can seem rather minor compared to corrections in individual stocks, which can easily see double- or triple-percentage declines in just a day or two. For example, take a look at the chart below on ZOOM (ZM), a company that recently reported blowout earnings, that fell almost 30% from its high to its low in just a few days.
All of this leading to: now what? To me, it's important to continue to zero in on those companies that reported the strongest earnings recently and may pull back to more attractive levels. These are stocks like AAPL, TSLA, SHOP - all in our Model Portfolio - that are likely to be targets once the current bout of selling ends.
At EarningsBeats.com, our focus is on those companies that beat both top- and bottom-line expectations and have promising charts. These stocks end up on our "Strong Earnings ChartList" and there are currently 498 stocks on the list. If you would like to get access to the entire list, just click here to sign up for a 30-day NO COST trial membership. And if you are a StockCharts.com Extra level member or higher, you will be able to download the entire list into your StockCharts account, which will allow you to sort and scan for those stocks that meet your specific criteria. Very powerful!
At your service,
John Hopkins
EarningsBeats.com